Journal of Machine Intelligence and Data Science (JMIDS)

Volume 4 - Year 2023 - Pages 35-53
DOI: 10.11159/jmids.2023.005
A Hybridized Deep Learning Methodology for Mitosis Detection and Classification from Histopathology Images
Nooshin Nemati1, Refik Samet1 ,Emrah Hancer2, Zeynep Yildirim1, Eyyup Ensar Akkas1
1Ankara University, Department of Computer Engineering
Bahcelievler, Golbasi, Ankara, 06830
nntolakan@ankara.edu.tr, samet@eng.ankara.edu.tr, yildirimz@ankara.edu.tr, eakkas@ankara.edu.tr
2 Victoria University of Wellington, School of Engineering and Computer Science
PO Box 600, Wellington, New Zealand, 6140
emrah.hancer@ecs.vuw.ac.nz
Abstract - Pathologists use histopathological images to diagnose cancer, and one key step in this process is to detect and classify mitosis. Mitosis is the process of cell division, and it is essential for normal tissue growth and repair. However, abnormal mitosis can be a sign of cancer. Therefore, the ability to accurately detect and classify mitosis is crucial for cancer diagnosis. Traditionally, pathologists rely on manual methods for this task, which are labor-intensive, time-consuming, and expensive. Computer-aided diagnosis (CAD) leverages technologies like artificial intelligence, fuzzy logic, and image processing to assist pathologists in early detection and classification. This study introduces a hybridized methodology for detecting and classifying abnormal mitosis in breast histopathological images. The proposed approach comprises two stages. In the initial stage, deep learning techniques are employed for mitosis detection. Subsequently, fuzzy-based classifiers are utilized in the second stage for mitosis classification. The methodology is applied to the ICPR12 and ICPR14 mitosis datasets. Results indicate a substantial enhancement in both accuracy and reliability of mitosis detection and classification, showcasing the effectiveness of the proposed approach.
Keywords: Histopathology, Mitosis detection, YOLOv8, Fuzzy-based classifier.
© Copyright 2023 Authors - This is an Open Access article published under the Creative Commons Attribution License terms. Unrestricted use, distribution, and reproduction in any medium are permitted, provided the original work is properly cited.
Date Received:2023-10-10
Date Revised: 2023-10-18
Date Accepted: 2023-10-25
Date Published: 2023-11-03
1. Introduction
The World Health Organization (WHO) uses the Nottingham grading of breast cancer [1]. There are three main indicators used by clinicians to determine the breast cancer grade: (a) extent of tubule formation as an expression of glandular differentiation; (b) nuclear pleomorphism; and (c) mitotic count. Mitotic count is one of the most powerful prognostic factors for invasive breast cancer, and therefore the mitotic count is the most important indicator for the assessment of the malignancy of breast cancer. Computer-aided diagnosis (CAD) is the use of computer software to analyze medical images and assist radiologists in diagnosing. In digital pathology, privately designed microscopes with strong cameras are used to seize High-Power Field (HPF) images at high resolutions [2]. Mitosis detection or count is a predominant objective parameter in breast cancer grading and staging unlike other types of cancers. Mitosis, the nuclei division process in living organisms, has four major phases: prophase, metaphase, anaphase, and telophase [3]. However, the biological differences between mitotic cells pose a major challenge to manual labeling and identification, making it slow and prone to misdiagnosis. Differences already exist between pathological sections under different collection instruments and conditions, while mitotic cell shape and configuration change continuously at different growth phases (prophase, metaphase, anaphase and telophase). Also, many cells (e. g. lymphocytes, apoptotic cells, dense nucleus) have a similar appearance to mitotic cells, making it difficult to effectively reduce the false positive rate. With this in mind, computer-aided diagnosis has become a hot topic in medical research, which can be roughly divided into two categories: traditional feature extraction algorithms and deep learning techniques.
Mitotic count is the primary objective parameter used to detect and classify breast cancer, in contrast to other cancer types. The task of detecting and classifying mitosis with high accuracy and reliability is challenging due to the following reasons: (1) mitoses are small objects with a wide range of shapes and texture formats; (2) the different terms for tissue staining; and (3) the image acquisition process increases the diversity of mitosis shapes appearance. The appearance of mitotic shapes plays a crucial role in the process of cancer grading [4]. The grading of cancers indicates how similar they are to the parent tissue. The main aim of cancer grading is to determine the aggressiveness of the cancer. It measures how far the disease has spread from the original organ to other parts of the body. Detection of mitosis is a measure of the rate of cell division and therefore of the grade of cancer [3].
The literature contains numerous studies on cancer diagnosis, focusing particularly on detecting and classifying mitosis. Significant progress has been made in cancer grading with the rapid advancement of deep learning models in cancer diagnosis. However, the desired level of accuracy and reliability in cancer diagnosis has not been achieved in the existing studies. The need for more effective research in the field has therefore increased [5]. Deep learning models for mitosis detection use false positives to learn the difference between mitotic and non-mitotic nuclei, but clinical datasets have more non-mitotic nuclei than mitotic nuclei, so the models are more likely to misclassify mitotic nuclei as non-mitotic.
This study proposes a methodology for mitosis detection and classification to address this need. The proposed methodology includes two stages. In the first stage, deep learning techniques, such as Mask R-CNN [6], YOLOv5 [7], and YOLOv8 [8] are used to detect mitosis. In the second stage, fuzzy-based classifiers are used to classify the mitosis. This stage increases the rate of true positive mitosis. The performance of the proposed methodology is verified on the ICPR12 and ICPR14 mitosis datasets.
The remainder of the paper is structured as follows. Section 2 summarises the related studies on mitosis detection and classification. Section 3 describes the proposed methodology. Section 4 discusses the implementation results. Finally, Section 5 presents the conclusions.
2. Related Work
Many studies have tried to detect and classify mitoses using deep learning and fuzzy-based techniques. A summary of some existing works is presented as follows:
Meriem Sebai et al. [9] proposed a two-stage Mask R-CNN-based framework, which firstly identifies the mitosis centroids and then detects mitosis based on instance segmentation. The framework respectively achieved F1-Scores of 0.863 and 0.475 on the ICPR12 and ICPR14 datasets.
Dodballapur et al. [10] proposed a detection scheme based on Mask R-CNN, which uses ResNet-50 as the feature extraction network. Implemented on the ICPR12 and ICPR14 datasets, this approach yielded notable results, particularly achieving a high recall rate. The F1-score reached 0.68 for ICPR14, making it the method that attained the highest score at this stage.
R. Yancey [11] proposed the use of object detection networks such as YOLO (YOLOv3, YOLOv4-scale, YOLOv5, and YOLOR) to improve the accuracy of mitosis counting. In these methods, the highest scores of 0.95 and 0.96 were achieved on the ICPR12 and ICPR14 mitosis datasets.
Nateghi et al. [12] proposed a method consisting of three main steps: mitotic activity region selection from the whole side image, mitotic cell detection, and tumor proliferation score estimation. Normalization was applied to the input image. A classification approach based on conventional neural networks was proposed to classify patches. Original and gamma-corrected hematoxylin patches were used to train an image-to-image regression model using U-Net. A total of 24 features were extracted, which were used to train an SVM classifier with Radian Basis Function (RBF) mitosis. In particular, an SVM classifier with RBF mitosis has good nonlinearity and can perform nonlinear classification efficiently.
Al Zorgani et al. [13] introduced a deep learning-based method to automate mitosis counting in histopathological images the method mainly applies YOLOv2 with ResNet-50 backbone network as a feature extractor. The mitosis detection process was conducted on the ICPR12 breast cancer histopathology dataset, yielding promising outcomes. The method demonstrated effectiveness with an F1-score of 0.839.
Thomas et al. [14] proposed an effective method for mitosis detection and segmentation in breast histopathology images. They utilized a fuzzy C-means clustering algorithm for initial mitosis detection and employed a random forest classifier for mitotic/non-mitotic classification. The random forest classifier handles imbalanced and incomplete datasets with efficiency and accuracy. Evaluation on the ICPR14 dataset resulted in a correctly classified sample rate of 82.0946 and an F1-score of 78.0, demonstrating the method's efficacy in segmentation and classification.
Anand et al. [15] introduced a Faster R-CNN model for detecting mitotic cells in breast tissue images. The model undergoes preprocessing steps such as Blot Normalization, Roboflow, resizing, and data augmentation. It identifies potential mitotic cell locations and conducts regression and classification for bounding boxes. The evaluation involved four backbone architectures, including ResNet-50-C4, ResNet-50-FPN, ResNet-101-FPN, and ResNeXT-101-32 × 8d-FPN, using the Mitosis Domain Generalization (MIDOG) 2021 dataset. Notably, the ResNeXt-101-32 × 8d-FPN backbone achieved the highest performance with an F1-score of 65.75.
Hwang et al. [16] presented a two-phase method for mitosis detection, involving candidate segmentation and detection. The first phase employs a fuzzy candidate segmentation method, dynamically determining threshold values to distinguish mitotic candidates from the background in gray-level images. In the detection phase, a two-class classification employs an attention mechanism implemented by a set of fully connected neural networks, reducing computational costs compared to convolutional layers. The validation test was conducted on ICPR12 competition datasets.
As seen in related works deep learning-based approaches for mitosis detection and classification have recently gained popularity due to their ability to learn complex features from data without the need for hand-crafted feature extraction. Deep learning-based methods typically involve using convolutional neural networks (CNNs) to classify image patches. These studies are ongoing and We proposed a hybrid methodology for mitosis detection and classification that combines the detection of deep learning methods and fuzzy-based classifier.
3. Materials and Methods
3.1. Datasets used in experiments
The most commonly used datasets for mitosis detection are ICPR12 [17], AMIDA13 [18], ICPR14 [19], TUPAC16 [20], MIDOG21 [21], MIDOG22 [22], and MIDOG++ [23]. In this study, the experiments focus on the ICPR12 and ICPR14 datasets. ICPR12 is a public dataset from the ICPR12 mitosis competition, featuring five breast cancer biopsy sections stained with H&E. Each slide comprises 10 high-power fields (HPF) at 40× magnification, selected by pathologists, totaling 50 HPFs with over 300 annotated mitotic cells. Scanning was performed using the Aperio XT scanner (scanner A), Hamamatsu Nano Zoomer scanner (scanner H), and a 10-band multispectral microscope (M). Mitosis in each HPF was annotated, including the ground truth of mitosis centers. This dataset, containing mask annotations, is employed to train a Mask R-CNN network for mask generation. The ICPR14 dataset, weakly annotated with mitosis centroids, was also evaluated to showcase the model's ability to generate reliable masks for datasets with limited annotations. ICPR14 includes mitosis detection and nuclear atypia assessment, with multi-expert opinions providing three evaluation categories: true mitosis, probable mitosis, and non-mitosis instances. Histopathological sections were stained by using Aperio Scanscope XT and Hamamatsu Nanozoomer 2.0-HT scanners.
3.2. Proposed Methodology
The overall methodology for mitosis detection and classification from H&E stained histopathology images is presented in Figure 1. The methodology involves the following stages: preprocessing, detection and classification. The stages are briefly explained in the following subsections.
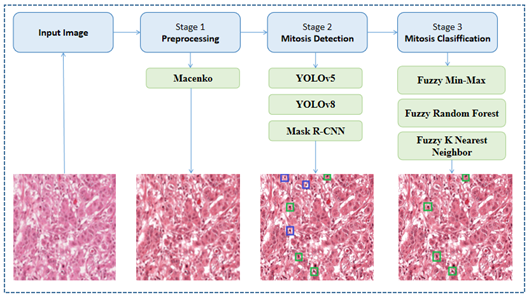
3.2.1 Preprocessing
In this stage, we apply the Macenko color normalization technique [24], which determines the stain vectors for each image based on the colors present. A pixel with an Optical Density (OD) value of 0 represents no light absorption. The technique then employs a mechanism to find the optimal threshold value of β. Finally, it projects the OD-transformed pixels onto the geodesic direction to determine the stain vector endpoints. It is worth noting that Macenko has been widely applied to H&E stained histopathology images since it can provide reduced color variations, improved feature consistency, and increased model robustness.
3.2.2 Mitosis detection
In the mitosis detection stage, we use the following algorithms:
- YOLOv5 [7]: YOLOv5 requires only a single pass through the neural network to predict all bounding boxes. This feature makes YOLOv5 faster than any other traditional detection algorithm. YOLOv5 consists of three main components: first is Cross Stage Partial Network (CSP) is used as the backbone to extract informative features from an input image CSPNet is used to achieve a good gradient combination and reduce the computational complexity, which is achieved by splitting the base layer feature map into two parts and joining them through a proposed cross-level hierarchy. The second component is the PANnet is used as a model throat that generates feature pyramids and scales the features. The YOLOv5 model uses the last component YOLO layer as the head layer for final object recognition. This layer generates 3 different sizes of feature maps (bounding boxes) to achieve optimal prediction. Depending on the size of the mitosis, this layer allows the model to deal with small, medium, and large mitosis.
- YOLOv8 [8]: YOLOv8 is an anchor-free model, which means that it does not use anchor boxes to predict the location and size of objects. Instead, YOLOv8 directly predicts the center point and size of objects. This makes YOLOv8 more accurate and efficient than YOLOv5, especially for small objects. The YOLOv8 architecture consists of two main parts: the backbone and the head. The backbone is a CNN that is responsible for extracting features from the input image. The head is a CNN that is responsible for predicting the presence of objects in the image, as well as their bounding boxes and class labels. The YOLOv8 backbone is a modified version of the CSPDarknet53 architecture. CSPDarknet53 is a very efficient CNN architecture that is well-suited for object detection tasks. The backbone part of YOLOv8 is basically the same as that of YOLOv5, and the C3 module is replaced by the C2f module based on the CSP idea. YOLOv8 and YOLOv5 are used because YOLOv8 is only being compared to YOLOv5. YOLOv5’s performance and metrics are closer to YOLOv8’s.
- Mask R-CNN with UNet++ [6]: Mask R-CNN uses the same two-stage procedure as previous systems, with the same first stage (RPN). However, in the second stage, Mask R-CNN predicts a binary mask for each ROI in addition to the class and bounding box offset. This is in contrast to most recent systems, where classification is dependent on mask predictions. The UNet++ backbone is an encoder-decoder network that extracts features from the input image at multiple scales. To implement a Mask R-CNN model with UNet++ as the backbone network, we first train a UNet++ model on the dataset. The anchor box sizes for Mask R-CNN are determined using an empirical approach, involving the clustering of the height and width of the ground truth bounding boxes in the training set. The model predicts masks for mitosis cells, along with confidence scores and bounding boxes that indicate the location and size of each mitosis.
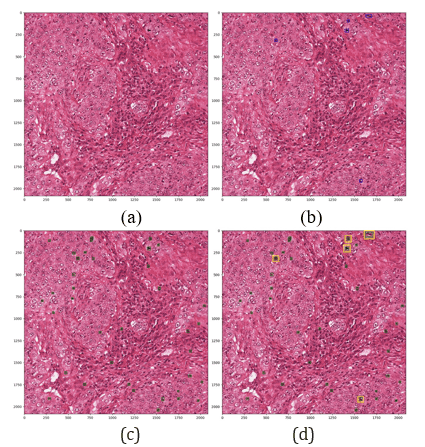
Figure 2 shows the detection of mitosis using Mask R-CNN. Figure 2.a shows the original image; Figure 2.b shows the image with ground truth annotation; Figure 2.c shows the masked mitosis in green by Mask R-CNN; and Figure 2.d shows the bounding boxes in yellow that match the ground truth mitosis. Other non-annotated cells are hard negative cells, which are false positives.
3.2.3 Mitosis classification
For the mitosis classification stage, we employ the following fuzzy-based classifiers, which are trained to learn the subtle patterns and characteristics that distinguish true mitosis from other structures. The classifiers are described as follows:
- Fuzzy Random Forest (FRF) [25]: FRF is an ensemble method based on fuzzy decision trees. This algorithm combines the strengths of random forests and fuzzy logic to create a machine learning algorithm that is robust to noise and missing data and can achieve good classification results with even relatively small ensembles. This algorithm is used to reduce bias in feature selection and handle imbalanced data effectively by adjusting the fuzzy membership degrees of the features according to the class distribution. This makes sure that the algorithm takes minority groups into account, resulting in more balanced and accurate forecasts. It combines the robustness of ensemble classification, the power of randomness in reducing the ratio between trees and increasing the range, and the flexibility of fuzzy logic in handling incomplete data.
- Fuzzy K Nearest Neighbor (FKNN) [26]: FKNN assigns class membership to a sample vector rather than assigning the vector to a particular class. The advantage is that no arbitrary assignments are produced by the algorithm. Fuzzy K Nearest Neighbor (FKNN) is a supervised algorithm that extends the traditional K-nearest neighbors (KNN) algorithm by incorporating fuzzy logic. KNN is a simple but effective algorithm that works by classifying new data points based on the labels of their K nearest neighbors in the training data. FKNN enhances the KNN algorithm by allowing each data point to have a degree of membership to each class, rather than simply assigning a single class label. This is done by calculating a fuzzy membership value for each data point to each class, based on its distance to the K nearest neighbors in that class. The fuzzy membership values are then used to predict the class label of the new data point.
- Fuzzy Min-Max (FMM) [27]: One of the major properties of this algorithm is that most of the processing is related to the detection and fine-tuning of the boundaries of the classes. In FMM, there are mainly 3 processes: expansion process, overlap test, and contraction process. FMM is a hyperbox classifier, which means that it divides the input space into a set of hyper boxes [28], each of which represents a different class. During training, FMM learns to create hyperboxes that enclose the data points of each class. For each new data point, FMM determines which hyper box it falls into and predicts the class label accordingly. FMM has several advantages over other classification algorithms. First, it is very fast and efficient, even for large datasets. Second, it is able to handle noisy and incomplete data. Third, it can be used to classify data with overlapping classes.
4. Results and Discussions
4.1 Experiment Design
The experiments are conducted using a PC with an NVDIA RTX 4000 GPU, Intel(R) Xeon(R) W-2245 CPU@3.90GHz, and 64GB System RAM with Python programming language via the Google Colab platform.
To verify the effectiveness of the proposed methodology on the datasets, Precision (defined by Eq. 1), Recall (defined by Eq. 2), and F1- Score (defined by Eq. 3) are used.

where NTP is the number of true positives, which is recognized as mitotic cells and is actually the number of mitotic cells. NFP is the number of false positives, which is actually the number of nonmitotic cells among detected mitotic cells NFN is the number of false negatives, which is recognized as non-mitosis and is actually the number of mitotic cells.
4. 2. Experiment Results
The experimental results are presented in Table 1 terms of precision, recall, and F1-score. According to the results, YOLOv8 generally outperforms the other algorithms in terms of precision, on both the ICPR12 and ICPR14 datasets. YOLOv8+FMM and YOLOv8+FKNN also perform well, especially on the ICPR14 dataset. The FMM and FKNN can help to improve the precision of YOLOv8 by reducing the number of false positives which is important for improving precision. The Mask R-CNN & UNet++ algorithms are designed to detect both objects and their masks. This may introduce some trade-offs in terms of precision, as the algorithms may be more likely to detect false positives when trying to segment complex objects. The performance of all of the algorithms is generally lower on the ICPR14 dataset than on the ICPR12 dataset. This suggests that the ICPR14 dataset is more challenging, possibly due to the presence of more occlusion, noise, and method of annotation.
Table 1. Implementation Results
|
Method |
ICPR12 |
ICPR14 |
||||
|
|
Precision |
Recall |
F1-Score |
Precision |
Recall |
F1-Score |
|
YOLOv5 |
0.843 |
0.76 |
0.801 |
0.818 |
0.757 |
0.79 |
|
YOLOv5 + FMM |
0.78 |
0.747 |
0.763 |
0.822 |
0.684 |
0.750 |
|
YOLOv5 + FKNN |
0.87 |
0.763 |
0.816 |
0.865 |
0.752 |
0.805 |
|
YOLOv5 + FRF |
0.89 |
0.873 |
0.881 |
0.895 |
0.848 |
0.873 |
|
Mask R-CNN & UNet++ |
0.72 |
0.812 |
0.766 |
0.67 |
0.784 |
0.727 |
|
(Mask R-CNN & UNet++) + FMM |
0.677 |
0.85 |
0.763 |
0.682 |
0.72 |
0.701 |
|
(Mask R-CNN& UNet++) + FKNN |
0.747 |
0.832 |
0.789 |
0.688 |
0.746 |
0.717 |
|
(Mask R-CNN& UNet++) + FRF |
0.78 |
0.886 |
0.833 |
0.703 |
0.788 |
0.745 |
|
YOLOv8 |
0.863 |
0.80 |
0.831 |
0.83 |
0.784 |
0.807 |
|
YOLOv8 + FMM |
0.83 |
0.823 |
0.826 |
0.829 |
0.783 |
0.806 |
|
YOLOv8 + FKNN |
0.88 |
0.87 |
0.875 |
0.85 |
0.828 |
0.839 |
|
YOLOv8 + FRF |
0.932 |
0.894 |
0.913 |
0.887 |
0.869 |
0.878 |
In general, the YOLOv5 and YOLOv8 have higher recall than the Mask R-CNN & UNet++ models. This is due to the fact that YOLO models are designed for speed and efficiency. The addition of the FMM, FKNN, and FRF to the YOLOv5 and YOLOv8 models generally leads to improved recall, but there are some exceptions. For example, the YOLOv5 + FMM model has a lower recall than the YOLOv5 model on the ICPR12 dataset. This suggests that the FMM may not be as beneficial for all datasets. The YOLOv5 and YOLOv8 models are both one-stage object detectors, which means that they can predict both the bounding boxes and class labels of objects in a single step. This makes them faster and more efficient than two-stage object detectors, such as Mask R-CNN & UNet++, which require two steps to predict bounding boxes and class labels.
The YOLOv8 + FRF has achieved the best performance on both datasets in terms of F1-score. The FKNN and FRF provide a significant improvement in performance for both YOLO variants, and Mask R-CNN and UNet++ methods. YOLOv8 is a single-stage method that is based on the YOLOv3 architecture. FKNN is a technique that uses a fast kernel nearest neighbor algorithm to improve the localization of bounding boxes. FRF is a technique that uses a fast region filtering algorithm to remove false positives. Overall, the behavior of the data is consistent with what would be expected from object detection. In summary, the YOLOv8 + FRF method is the best-performing method on both ICPR12 and ICPR14.
5. Conclusion
The mitosis detection and classification process is a crucial task in cancer staging and grading. The task is challenging since the shapes of nuclei and mitosis are very similar, and during the detection process, some of the nuclei are recognized as mitosis. Due to this challenge, the performance of mitosis detection and classification and thereby the reliability of analyzing the grade and stage of cancer are adversely affected. This can lead to improved patient outcomes, as patients with more aggressive cancers can be identified earlier.
In this paper, we proposed a mitosis detection methodology. In the proposed methodology, mitotic cells were first detected using YOLOv5, YOLOV8, and Mask R-CNN object detection algorithms. For mitosis classification, Fuzzy K Nearest Neighbor, Fuzzy Min-Max, and Fuzzy Random Forest were used. The results showed that the proposed methodology significantly improves the accuracy of mitosis detection and classification.
In the future work, the proposed methodology will be implemented and evaluated on new datasets.
Acknowledgments
This work is supported by Turkish Scientific and Research Council (TUBITAK) under Grant No 121E379.
References
[1] C. W. Elston, I. O. Ellis, Pathological prognostic factors in breast cancer. I. The value of histological grade in breast cancer: Experience from a large study with long-term follow-up, Histopathology, 19, 1991, pp. 403-410. View Article
[2] G. Jiménez, D. Racoceanu, Deep learning for semantic segmentation vs. classification in computational pathology: Application to mitosis analysis in breast cancer grading, Front. Bioeng. Biotechnol., 2019, pp. 7-145. View Article
[3] T. Mathew, R. K. Jyoti, and R. Jeny, "Computational methods for automated mitosis detection in histopathology images: A review," Biocybernetics and Biomedical Engineering, vol. 41, no.1, pp. 64-82, 2021. View Article
[4] Nemati, N., Samet, R., Hancer, E., Yildirim, Z. and Traore, M., A Mitosis Detection and Classification Methodology with YOLOv5 and Fuzzy Classifiers. Proceedings of the 9th World Congress on Electrical Engineering and Computer Systems and Sciences (EECSS'23), MVML, P. 111.
[5] Hancer, E., Traoré, M., Samet, R., Yıldırım, Z., & Nemati, N. An imbalance-aware nuclei segmentation methodology for H&E stained histopathology images. Biomedical Signal Processing and Control, 83, 104720, 2023. View Article
[6] He, K., Gkioxari, G., Dollár, P., & Girshick, R. Mask r-cnn. In Proceedings of the IEEE international conference on computer vision, 2017, pp. 2961-2969. View Article
[7] G. Jocher, A. Stoken and J. Borovec, "NanoCode012, ChristopherSTAN, L," Changyu, Laughing, tkianai, A. Hogan, lorenzomammana, yxNONG, AlexWang1900, L. Diaconu, Marc, wanghaoyang0106, ml5ah, Doug, F. Ingham, Frederik, Guilhen, Hatovix, J. Poznanski, J. Fang, L. Yu, changyu98, M. Wang, N. Gupta, O. Akhtar, PetrDvoracek, and P. Rai, ultralytics/yolov5: v3, vol. 1, 2020.
[[8] Glenn, J. https://github.com/ultralytics/ultralytics. Ultralytics yolov8, 2023. View Article
[[9] Sebai M, Wang X, Wang T. MaskMitosis: a deep learning framework for fully supervised, weakly supervised, and unsupervised mitosis detection in histopathology images. Med Biol Eng Comput. 2020 Jul;vol. 58, no. 7, pp.1603-1623. View Article
[10] Dodballapur, V., Song, Y., Huang, H., Chen, M., Chrzanowski, W., & Cai, W. (2020, November). Dual-Stage Domain Adaptive Mitosis Detection for Histopathology Images. In 2020 Digital Image Computing: Techniques and Applications (DICTA) IEEE. pp. 1-7. View Article
[11] Yancey, R. Parallel YOLO-based Model for Real-time Mitosis Counting, 2023. View Article
[12] Nateghi, R., Danyali, H. and Helfroush, M.S. A deep learning approach for mitosis detection: application in tumor proliferation prediction from whole slide images. Artificial intelligence in medicine, 102048, 2021. View Article
[13] Al Zorgani, M.M., Mehmood, I. and Ugail, H. Deep yolo-based detection of breast cancer mitotic-cells in histopathological images. In Proceedings of 2021 International Conference on Medical Imaging and Computer-Aided Diagnosis (MICAD 2021) Medical Imaging and Computer-Aided Diagnosis, 2022, pp. 335-342. View Article
[14] Thomas, R.M. and John, J. Detection and segmentation of mitotic cell nuclei in breast histopathology images. In 2017 International Conference on Network & Advances in Computational Technologies (NetACT); IEEE, 2017, pp. 246-250. View Article
[15] Anand, H., Rajan, A. K., Santhosh, G. and Nair, L. S. . Mitotic Instance Detection in Stain Normalized Histopathological Images using Faster R-CNN. In 2022 7th International Conference on Communication and Electronics Systems (ICCES); 2022, pp. 1310-1313. View Article
[16] Hwang, M., Wang, D., Wu, C., Jiang, W. C., Kong, X. X., Hwang, K. S., & Ding, K. A fuzzy segmentation method to learn classification of mitosis. International Journal of Fuzzy Systems, 22, 2022, pp. 1653-1664. View Article
[17] R. Ludovic, R. Daniel, L. Nicolas, K. Maria, I. Humayun, K. Jacques, and G.Catherine, "Mitosis detection in breast cancer histological images An ICPR 2012 contest," Journal of Pathology informatics, vol. 4, no. 1, p. 8, 2013. View Article
[18] M. Veta, M. A. Viergever, J. P. Pluim, N. Stathonikos, and P. J. van Diest, "MICCAI Grand Challenge: Assessment of mitosis detection algorithms," AMIDA13.
[19] L. Roux, D. Racoceanu, F. Capron, J. Calvo, E. Attieh, G. Le Naour and A. Gloaguen, "MITOS & ATYPIA-Detection of mitosis and evaluation of nuclear atypia score in breast cancer histological images," IPAL, Agency Sci, Technol Res Inst Infocom Res. Technol. Res. Inst. Infocom Res., Singapore, Tech. Rep.
[20] M. Veta, Y. Heng, N. Stathonikos, B. E. Bejnordi, F. Beca, T. Wollmann and J.P. Pluim, "Predicting breast tumor proliferation from whole-slide images" the TUPAC16 challenge. Medical image analysis, vol. 54, pp. 111-121, 2019. View Article
[21] Wilm, F., Marzahl, C., Breininger, K., Aubreville, M.: Domain adversarial retinanet as a reference algorithm for the mitosis domain generalization challenge. In: International Conference on Medical Image Computing and Computer-Assisted Intervention, Springer. pp. 5-13, 2021. View Article
[22] Aubreville, M., Stathonikos, N., Bertram, C.A., Klopfleisch, R., Ter Hoeve, N., Ciompi, F., Wilm, F., Marzahl, C., Donovan, T.A., Maier, A., et al.: Mitosis domain generalization in histopathology images-the midog challenge. Medical Image Analysis 84, 102699, 2023. View Article
[23] Aubreville, M., Wilm, F., Stathonikos, N., Breininger, K., Donovan, T.A., Jabari, S., Veta, M., Ganz, J., Ammeling, J., Diest, P.J., et al.: A comprehensive multi-domain dataset for mitotic figure detection. Scientific Data vol. 10, no. 1, p. 484, 2023. View Article
[24] M. Macenko, M. Niethammer, J. S. Marron, D. Borland, J. T. Woosley, X. Guan and N. E. Thomas, "A method for normalizing histology slides for quantitative analysis," in 2009 IEEE international symposium on biomedical imaging: from nano to macro, 2009, pp. 1107-1110. View Article
[25] P. Bonissone, J. M. Cadenas, M. C. Garrido and R. A. Díaz-Valladares, "A fuzzy random forest". International Journal of Approximate Reasoning, vol. 51, no. 7, pp. 729-747, 2010. View Article
[26] J. M. Keller, M. R. Gray, and J. A. Givens, "A fuzzy k-nearest neighbor algorithm," IEEE Trans. Syst., Man, Cybern., Vol. 15, pp. 580-5, Jul.-Aug. 1985. View Article
[27] P. K. Simpson, "Fuzzy min-max neural networks. I. Classification," IEEE Trans. Neural Netw., vol. 3, no. 5, pp. 776-786, Sep. 1992. View Article
[28] Girshick, R.; Donahue, J.; Darrell, T.; Malik, J. Region-Based Convolutional Networks for Accurate Object Detection and Segmentation. IEEE Trans. Pattern Anal. Mach. Intell. 2015, vol. 38,pp. 142-158. View Article