Journal of Machine Intelligence and Data Science (JMIDS)

Volume 6 - Year 2025 - Pages 23-33
DOI: 10.11159/jmids.2025.002
Leveraging Machine Learning for Enhanced Customer Satisfaction Analysis: A Case Study
Rosa Arboretti1, Elena Barzizza2, Nicolò Biasetton2, Riccardo Ceccato2, Luigi Salmaso2
1University of Padova, Department of Civil, Environmental and Architectural Engineering,
Via Marzolo 9, Padova, Italy, 35131
rosa.arboretti@unipd.it;
2University of Padova, Department of Management Engineering,
Stradella San Nicola 3, Vicenza, Italy, 36100
elena.barzizza@phd.unipd.it, nicolo.biasetton@unipd.it, riccardo.ceccato.1@unipd.it, luigi.salmaso@unipd.it
Abstract - Understanding and analysing customer satisfaction is crucial for businesses striving to maintain or enhance their competitive edge in today's rapidly evolving markets. Customer satisfaction serves as a direct indicator of how well a company meets consumer expectations, making it a key determinant of long-term success. By focusing on customer satisfaction levels, companies can improve product development to better align with consumer needs. A machine learning-based tool is introduced, designed to analyse customer satisfaction data and identify the most impactful drivers. By clustering drivers before analysis, the tool provides a comprehensive understanding of the relationship among various aspects of customer satisfaction. A case study is conducted to demonstrate the practical application and effectiveness of the proposed tool, offering valuable insights for research and development purposes. Future efforts will focus on integrating generative AI to enhance the monitoring of customer satisfaction by scraping online consumer reviews. These reviews can be analysed to conduct aspect-based sentiment analysis, which will help identify emerging aspects of customer satisfaction that require attention.
Keywords: Customer satisfaction, Machine learning, Cluster.
© Copyright 2025 Authors - This is an Open Access article published under the Creative Commons Attribution License terms. Unrestricted use, distribution, and reproduction in any medium are permitted, provided the original work is properly cited.
Date Received: 2024-04-10
Date Revised: 2024-10-15
Date Accepted: 2024-11-12
Date Published: 2025-02-25
1. Introduction
In today competitive markets, companies have a primary focus is on developing strategies to satisfy customers, with the ultimate goal of boosting profits, improving competitive positioning, and maintaining market share (Cengiz [1]). An important area of research explores how customer satisfaction influences a company's competitiveness and profitability. Significant emphasis is placed on developing accurate methods to measure customer satisfaction, given its critical impact on business success. In fact, a strong connection exists between customer satisfaction and a company's overall performance (Yeung & Ennew [2]).
Analysing customer satisfaction offers several advantages: it enhances a company's marketing capabilities by enabling a focus on customer preferences (Bhat & Darzi [3]; Ming [4]), facilitates the creation of demand management strategies tailored to specific customer segments (Bhat & Darzi [3]), and provides valuable insights for research and development teams to design products that meet consumer expectations (Haslinah et al. [5]). From both theoretical and practical perspectives, customer satisfaction is crucial for marketers and consumer researchers alike (Westbrook & Oliver [6]; Dabholkar et al. [7]; Goode & Moutinho [8]; Patterson [9]; Spreng et al. [10]; Fournier & Mick [11]; Meuter et al. [12]).
Advancements in machine learning and big data technologies have enabled the analysis of vast datasets, leading to the development of highly precise prediction and classification models (Kumar & Zymbler [13]). In particular, the use of machine learning can assist in uncovering hidden data relationships, making it a valuable tool for analyzing consumer data. By doing so, it helps identify the key drivers that impact customer satisfaction, providing deeper insights into customer preferences and behavior. This is particularly valuable, as businesses seek to understand which factors have the greatest impact on satisfaction in order to guide strategic decisions (Tama [14]). In particular, understanding how product attributes influence customer satisfaction is crucial for businesses aiming to make informed decisions about product development (Imtiaz & Ben Islam [15]).
The majority of customer satisfaction studies in the literature gather consumer data either by distributing questionnaires to a sample of respondents or by extracting reviews from online sources (see for instance Li et al. [16], Zhao et al. [17] or Goode & Moutinho [8]). Customer satisfaction surveys typically gather information on various product features, allowing researchers to assess consumer perceptions across multiple aspects. These questionnaires provide insights into how different product characteristics contribute to overall satisfaction, offering a comprehensive view of consumer preferences and expectations. When numerous product features are evaluated, there is often overlap where several variables relate to different facets of the same overarching aspect. For example, variables such as shape, material, and color may all contribute to the broader concept of "packaging". When these individual features are assessed independently, it becomes difficult to clearly understand how the general aspect, in this case, "packaging", impacts overall customer satisfaction.
To address this challenge, we extend the machine learning-based methodology illustrated in Barzizza et al. [18]. This extension first clusters the drivers by grouping them according to their broader aspects. The objectives of this machine learning methodology are twofold. Firstly, this approach is designed to predict the impact of each cluster on achieving the highest possible overall satisfaction rating. Instead of evaluating individual features separately, as in Barzizza et al. [18], we analyze the combined influence of related features as a whole. As previously anticipated, this is particularly advantageous in situations characterized by a considerable number of drivers to analyse, where different drivers may refer to the same aspect of a product, making the identification of its overall impact challenging. Secondly, it forecasts the potential improvement in overall satisfaction resulting from enhancements within specific clusters. This enables businesses to identify which broader product aspects, if improved, would contribute most significantly to overall satisfaction, allowing for a more targeted and efficient product development strategy.
The structure of the article is as follows: Section 2 provides a detailed explanation of the proposed machine learning methodology, covering data transformation, the creation of clusters, and the prediction of both variable impact and areas for advancements. In Section 3, a case study is presented to demonstrate the practical application and effectiveness of the methodology. Section 4 discusses further enhancements to the approach, particularly through the integration of generative AI. Finally, Section 5 concludes with closing remarks and reflections.
2. Methodology
2.1. Data transformation
Typically, to analyse customer perception of a product or service, customized questionnaires are designed to gather feedback on various aspects of the product or service that customers have tested. These surveys often utilize Likert scales, such as 5-point or 10-point scales, to quantify levels of agreement or satisfaction. By using and analysing such questionnaires, companies can capture nuanced insights into customer experiences, preferences, and expectations, allowing for a more detailed understanding of key factors that influence customer satisfaction and product performance in the market.
Analysing this data can present a significant challenge, as relying on a simple average value is not a robust approach and can lead to misleading conclusions (Jones & Sasser [19]). Indeed, averages can obscure important patterns in the data, such as the presence of highly satisfied or dissatisfied customers, which are crucial for understanding the true customer perception of the product or service. Rather than relying on the average value, it would be more effective for the company to transform the data in ways that highlight key insights, such as focusing on the highest ratings. An effective approach to achieve more accurate results may involve utilizing a top box metric (Morgan & Rego [20]). Indeed, the top-rated consumers are typically the most loyal and valuable, as they consistently express the highest level of satisfaction and are more likely to make repeat purchases (Jones & Sasser [19]), contributing significantly to long-term business growth.
As a result, the first step in the methodology involves transforming all Likert scale responses into binary variables to standardize them on a common scale: TB (top box score) and Other (remaining scores).
2.2. Cluster creation
In many questionnaires, several questions often address the same aspect, such as design. This overlapping can make it challenging to interpret the results, as it may be unclear how much value consumers place on a specific feature. Furthermore, quantifying the overall impact that the variables related to a specific aspect of the product have on overall satisfaction may not be straightforward when considering the drivers individually. The solution we propose is to group the drivers into clusters. To achieve this, we employed the clustering algorithm implemented in the ClustOfVar package in R (Chavent, Kuentz, Liquet & Saracco [21]).
The clustering algorithm consists of two fundamental steps: an initial initialization phase followed by an iterative phase. The iterative phase concludes either after a user-defined maximum number of iterations or when no further changes are observed in the partition produced by the algorithm. We will now provide a detailed examination of the algorithm. Let us examine the scenario where we have p drivers and aim to organize them into K clusters.
The first phase of the algorithm involves a process of random initialization. Note that, as an alternative to random initialization, it is also possible to provide a custom initialization as input.
At this stage, k drivers are randomly selected from the overall set of p drivers to act as the initial central synthetic variables ck, known as centres. Following this selection, an initial partition into k clusters is established by assigning each driver to the cluster whose centre is closest to it. To determine this proximity, the algorithm employs the calculation of the similarity between each driver and the selected initial centres. An explanation of the similarity measure between two variables can be found in Chavent, Kuentz, Liquet, and Saracco [21]. They highlight the importance of selecting appropriate similarity measures based on the characteristics of the variables: depending on the type of variable, different similarity measures are used. In our approach, we concentrate on qualitative variables, as our data is classified using binary categories; therefore, a correlation ratio is applied.
In the second step of the algorithm, the process is repeated through two key actions: the representation step and allocation step. First, the algorithm calculates the quantitative central synthetic variable ck for each cluster ck using the PCAMIX method. This calculation helps define the centre of each cluster based on the data at hand. Next, a new partition is created by assigning each driver to the cluster with the closest centre. To evaluate this proximity, the algorithm measures the similarity between each driver and the central synthetic variable of its respective cluster, just as it did previously.
The second iterative step concludes when one of two conditions is fulfilled: either there are no further changes in the partition, or the maximum number of iterations defined by the user is reached.
At this point, the algorithm provides us with k clusters, each characterized by a specific number of drivers based on their similarity. However, a challenge arises in creating a synthetic variable that summarizes the information contained within each driver belonging to a particular cluster; thus, a cluster variable needs to be established. Several strategies can be employed for this purpose.
An approach is to construct a synthetic cluster variable by assigning values based on the presence of TB ratings among the drivers in the cluster. Specifically, we can assign a TB if at least one of the drivers in the cluster contains a TB, a TB if at least 50% of the drivers exhibit a TB, or a TB only if all drivers within the cluster contain a TB. The first option is the least conservative, while the last option is the most conservative, with the second option representing an intermediate approach. The choice among these strategies depends on the specific goals of our analysis.
2.3. Prediction of the Variable Impact
The first main goal of our methodology is to evaluate the impact of a cluster, cj , on the binary response variable , which may represent our Key Performance Indicator (KPI), such as overall satisfaction or another relevant measure (i.e. overall liking).
To quantify the influence of each cluster on the KPI, we refer to what we define as “Variable Impact”. The prediction of Variable Impact is based on the application of an appropriate machine learning model that can most accurately capture the relationships present in the data. The first step, therefore, involves applying a set of classification machine learning models that are suitable for our dataset, making it necessary to identify the model that most effectively predicts the key performance indicator of interest. To effectively determine the most suitable machine learning model, it is crucial to assess the model's performance thoroughly. This entails selecting an appropriate error metric and employing resampling methods to ensure reliable evaluation. When it comes to selecting an error metric, the Area Under the Curve (AUC) is the most suitable option, as it allows for a comprehensive assessment of a model’s ability to distinguish between different classes (Bradley 1997). To further refine the selection of the most effective machine learning model and mitigate the risk of overfitting, we employ cross-validation techniques. In particular, 10-fold cross-validation is used for hyperparameter tuning and model selection. After performing cross-validation, we calculate the AUC for each model and choose the one with the highest AUC. This selected model can then be utilized to analyse the relationships between the input clusters and the response.
Let Do be a typical consumer dataset which includes a KPI of interest, such as overall satisfaction and various aspects of a product or service represented by different the different clusters obtained before, cj,j=1,…,K. Let’s focus on predicting the impact of a generic cluster cj on the KPI of interest. In other words, this involves forecasting, using the selected machine learning model, the effect that this cluster has in terms of the probability of obtaining a TB response for the KPI. To accomplish this, it is necessary to consider two datasets derived from the original dataset Do, namely D1j and D2j:
- D1j is a fictional dataset generated from Do by substituting the actual values of Cj with the positive level of the binary variable, designated as TB.
- D2j is a fictional dataset generated from Do by substituting the actual values of Cj with the negative level of the binary variable, designated as Other.
The previously selected machine learning
model is applied to both datasets ![]() and
and ![]() to predict the
probability of obtaining a TB response for the KPI across all observations. In
particular,
to predict the
probability of obtaining a TB response for the KPI across all observations. In
particular, ![]() and
and ![]() are respectively the
predicted TB probability of the KPI of observation
are respectively the
predicted TB probability of the KPI of observation ![]() in dataset
in dataset ![]() and
and ![]() . The Variable Impact of
. The Variable Impact of ![]() is then calculated as:
is then calculated as:
![]()
Where, ![]() and
and ![]() are respectively the
average probability of all
are respectively the
average probability of all ![]() and
and ![]() :
:
2.4. Prediction of the Area for Advancement
Companies often strive to understand how enhancements to certain product features, like packaging, can impact a specific KPI such as the overall customer satisfaction.
Therefore, the second objective of the proposed methodology is to gain insights into how improvements in specific clusters of drivers, such as design, may impact the KPI of interest. This involves evaluating the potential increase in the probability of obtaining a TB response for the KPI as a result of enhancing a particular cluster input, Cj, for a given product. We refer to this as the area for advancement.
The initial steps remain consistent with those previously outlined, focusing on accurately selecting the best performing machine learning model that aligns best with the data. As before, a 10-fold cross-validation is employed for hyperparameter tuning and model selection, resulting in the selection of the model that achieves the highest AUC.
To predict the Area for Advancement of ![]() , the chosen machine
learning model must be applied to the original dataset
, the chosen machine
learning model must be applied to the original dataset ![]() as well as to an
additional dataset
as well as to an
additional dataset ![]() , which is obtained
as previously described. This approach enables the prediction of the TB
probability of the KPI for each observation
, which is obtained
as previously described. This approach enables the prediction of the TB
probability of the KPI for each observation ![]() (
(![]() ). Consequently,
). Consequently, ![]() and
and ![]() represent the predicted
TB probabilities of the KPI for observation
represent the predicted
TB probabilities of the KPI for observation ![]() in datasets
in datasets ![]() and
and ![]() , respectively. The Area for
Advancement for
, respectively. The Area for
Advancement for ![]() is then calculated as:
is then calculated as:
![]()
Where, ![]() and
and ![]() are respectively the
average probability of all
are respectively the
average probability of all ![]() and
and ![]() :
:
3. Case study
This section introduces a practical case study focused on the development of a new food product. The R&D team of the food company has developed a new version of protein cream to expand its range of spreadable creams. Before moving forward with further development and launching the product, they intend to compare it with a well-known competitor in the market. This comparison will help them refine the product and strengthen its competitive advantage.
To support this, a study is planned in which 599 consumers will test the new protein cream alongside a competitor for one month. At the end of the trial period, participants will be asked to complete a questionnaire. The survey will require them to rate their overall satisfaction (overall liking), as well as their satisfaction with various specific features of the product, using a Likert scale ranging from 1 to 10. This feedback will provide valuable insights into the performance of both products.
In addition to assessing the overall liking of the product, the questionnaire evaluated a wide range of characteristics related to the protein cream. It assessed sweetness, the intensity of aromas, the aftertaste and the authenticity of the taste. Moreover, it considers how well the product meets nutritional needs, including protein, sugar, fat, carbohydrate content, and caloric intake. The survey also evaluated the product's compatibility with vegan and gluten-free diets, as well as other allergen-free dietary needs. In addition to nutritional aspects, the material and design of the product packaging were examined, along with its ability to maintain the quality of the product over time. Textural attributes like crunchiness, creaminess and softness were also assessed. The study explored whether the cream could serve as a suitable substitute for traditional products and its versatility as a topping or ingredient in various recipes. Furthermore, the questionnaire evaluated the presence of natural or organic ingredients, the certification of origin for raw materials, and details regarding ingredient sourcing. Serving size, bulk options, and factors like ease of opening and storage were also analyzed. The participants provided feedback on short-term and long-term satiety, the adequacy of portion sizes, food expiration, and recommended storage conditions. Finally, the study looked into the product's shelf stability, environmental impact, and the recyclability of its materials. Overall, this thorough evaluation aimed to gather detailed consumer insights on the new protein cream and its positioning in the market.
The primary goal of this study was to identify which features of the product had the greatest impact on the likelihood of receiving a TB rating in terms of overall customer satisfaction expressed by the overall liking. Additionally, the study aimed to compare the prototype with a competitor’s product to determine which features were perceived more favourably in the prototype. This comparison would help assess how much improving certain features could enhance overall satisfaction. However, many of the product’s features are interconnected and influence similar aspects of the user experience, making it challenging to isolate which specific features have the most direct effect on overall satisfaction. This complexity adds an additional layer of difficulty in pinpointing the areas that should be prioritized for further enhancement.
To overcome this challenge, the features evaluated in the questionnaire were clustered into groups using the procedure described earlier. This allowed common aspects to be grouped together, enabling a more comprehensive analysis that focuses on broader product attributes rather than individual drivers. Table 1 presents, in the first column, the individual drivers evaluated in the study, while the second column shows the corresponding cluster to which each driver was assigned. The synthetic variables for each cluster were obtained by assigning a TB rating if at least 50% of the evaluations for the individual drivers within that cluster received a TB rating.
Table 1. Individual product drivers and their corresponding clusters
|
Driver |
Cluster |
|
Sweetness |
Taste
|
|
Intensity of aromas |
|
|
Aftertaste |
|
|
Authenticity of taste |
|
|
Protein content |
Nutrition value
|
|
Sugar content |
|
|
Fat content |
|
|
Carbohydrate content |
|
|
Caloric intake |
|
|
Allergen-free options |
Dietary compatibility |
|
Alignment with vegan dietary |
|
|
Alignment with gluten free dietary |
|
|
Material |
Packaging |
|
Maintenance of the product characteristics |
|
|
Design |
|
|
Crunchiness |
Texture |
|
Creaminess |
|
|
Softness |
|
|
Substitute for traditional products |
Versatility |
|
Use as topping |
|
|
Use as ingredients for different recipes |
|
|
Natural/organic ingredients |
Ingredients quality |
|
Certification origin raw materials |
|
|
Ingredient sourcing |
|
|
Serving size |
Quantity |
|
Bulk options |
|
|
Ease of opening |
Practicality |
|
Ease of storage |
|
|
Short-term satiety |
Satiation |
|
Long-term satiety |
|
|
Adequate portion size |
|
|
Food expiration |
Perishability |
|
Conditions for storage |
|
|
Shelf stability |
|
|
Environmental impact |
Sustainability |
|
Recycling materials |
These clusters variables were then used for analysis through the machine learning methodology explained earlier. This approach allowed for an easy evaluation of the product's features by focusing on broader clusters rather than isolated drivers. To illustrate this point, for instance, consider the individual drivers such as sweetness, the intensity of aromas, the evaluation of the aftertaste and the authenticity of taste.
Analyzing each of these drivers separately may lead to challenges in understanding their overall impact on overall liking. In contrast, if we use a synthetic variable that aggregates these individual drivers into a single taste cluster, we can more easily assess its relationship with overall liking. If this cluster collectively receives a TB rating, it indicates that, overall, customers perceive the taste positively, regardless of the variations in individual driver ratings. This holistic view simplifies the analysis, allowing us to draw clearer conclusions about how sound quality as a whole impact on overall liking.
3.1 Prediction of the Variable Impact
The purpose of this first part of the analysis is to quantify the impact that different clusters have on the likelihood of achieving a TB rating in overall liking. By examining how each cluster influences customer ratings on KPI, we aim to identify which aspects of the product are most significant in driving overall satisfaction expressed by the overall liking. This quantitative assessment will provide valuable insights for prioritizing improvements and refining the product to better meet customer needs.
The first step in the process involved testing multiple machine learning models for the classification task to identify the model that best fits the data and yields the most precise predictions. To achieve this, 10-fold cross-validation was employed for hyperparameter tuning and model selection. Cross-validated AUC scores were utilized to select the most effective model. Table 2 presents the AUC metrics for the different machine learning models evaluated for classification purposes. For confidentiality reasons, we will refer to them as Model1, Model2, Model3, and Model4.
Table 2. AUC metrics for various machine learning models assessed for classification tasks.
|
ML model |
Cross-validated AUC |
|
Model1 |
87 |
|
Model2 |
87.7 |
|
Model3 |
87.6 |
|
Model4 |
87.2 |
The findings reveal robust performance from all models, with AUC values nearing their maximum. Remarkably, the Model2 stood out as the highest performer and was subsequently chosen for predicting the Variable Impact.
The Model2 was subsequently employed to assess Variable Impact, with the results illustrated in Figure 1. This figure presents a table detailing the key clusters of drivers that influence the likelihood of achieving a TB response in overall liking. It includes their predicted impact values, complemented by proportional bar graphs for visual clarity.
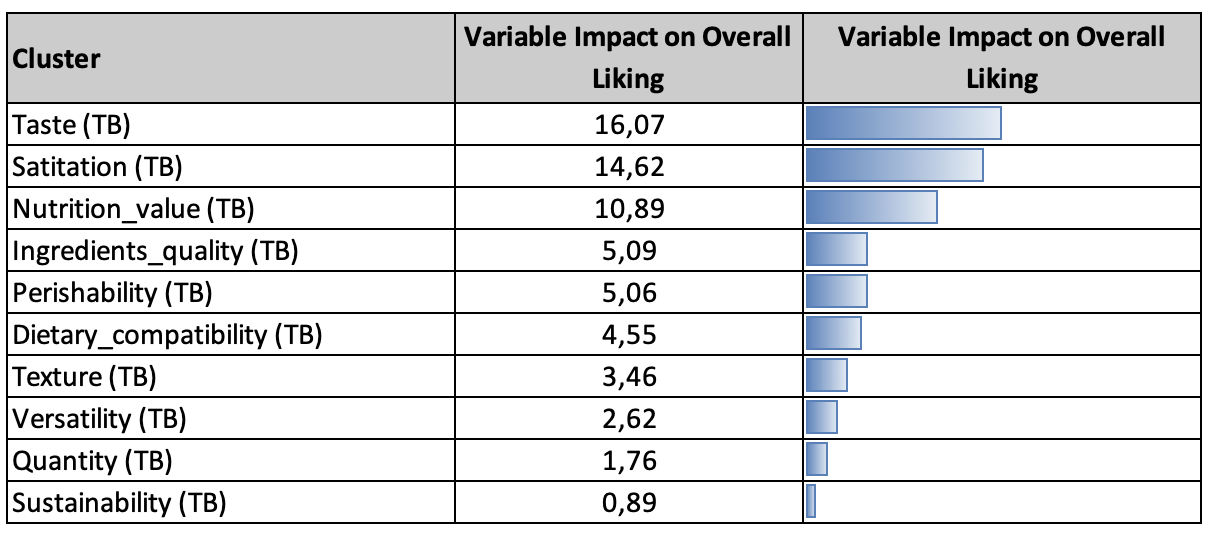
The table lists the clusters in descending order of variable impact, allowing for immediate identification of those that most significantly contribute to achieving a TB evaluation in overall liking. It is evident that some clusters have a substantial impact, while others are less influential, and some clusters have minimal or no effect at all.
For instance, clusters such as taste, satiation, and nutrition value demonstrate a significant impact on achieving a TB evaluation on overall liking. The company should recognize the importance of these aspects and prioritize enhancements in these areas to increase the likelihood of attaining a TB rating in overall liking. Additionally, clusters like ingredients quality and perishability show a moderately significant impact, exceeding 5%. The table indicates that improvements in these areas should be considered after addressing the more critical clusters.
On the other hand, some clusters, such as sustainability, exhibit a very limited impact. Similarly, clusters like practicality and packaging do not seem to have a significant influence on overall liking. This finding is crucial, as it suggests that improving these less impactful aspects may not substantially enhance overall liking of the protein cream. Consequently, it would be more advantageous to focus on improvements in the features that consumers deem important.
This analysis provides insight into how different clusters of drivers influence the likelihood of receiving a TB evaluation in overall liking. However, it is important to note that this analysis alone is insufficient. While it offers general indications about the product type, it does not reveal how consumers perceive the prototype in comparison to the competitor. We lack information on which clusters of drivers are viewed as better or worse in the prototype, and we also do not have a clear understanding of how much improvements in specific product areas could enhance the percentage of TB ratings in overall liking. To address these questions, it is necessary to consider the results from the second part of the analysis.
3.2 Prediction of the Area for Advancements
In this second part of the case study, we focus on comparing the prototype and the competitor to gain a deeper understanding of how consumers perceive the two products. Furthermore, we employ the machine learning methodology outlined earlier to enhance our insights. By applying this advanced analytical technique, we can predict how improvements in specific aspects of the prototype may significantly influence consumer satisfaction and ultimately lead to an increase in the TB percentage of our KPI (overall liking). This approach not only deepens our understanding of consumer behaviour but also provides actionable recommendations for enhancing the product's competitiveness in the market.
The first step involves applying various machine learning models for classification tasks. Four different machine learning models were utilized: Model1, Model2, Model3 and Model4.
We then evaluate these models using cross-validation techniques to ensure their reliability and robustness. The model that demonstrates the best cross-validated AUC is selected for further analysis. Table 3 displays the cross-validated AUC results for the models applied in our case study.
Table 3. AUC metrics for various machine learning models assessed for classification tasks.
|
ML model |
Cross-validated AUC |
|
Model1 |
86.9 |
|
Model2 |
87.6 |
|
Model3 |
87.3 |
|
Model4 |
86.9 |
All the models exhibited good performance; however, the Model2 was selected for further analysis due to its superior AUC score.
The results from the application of the second part of the methodology are illustrated in the graph presented in Figure 2.
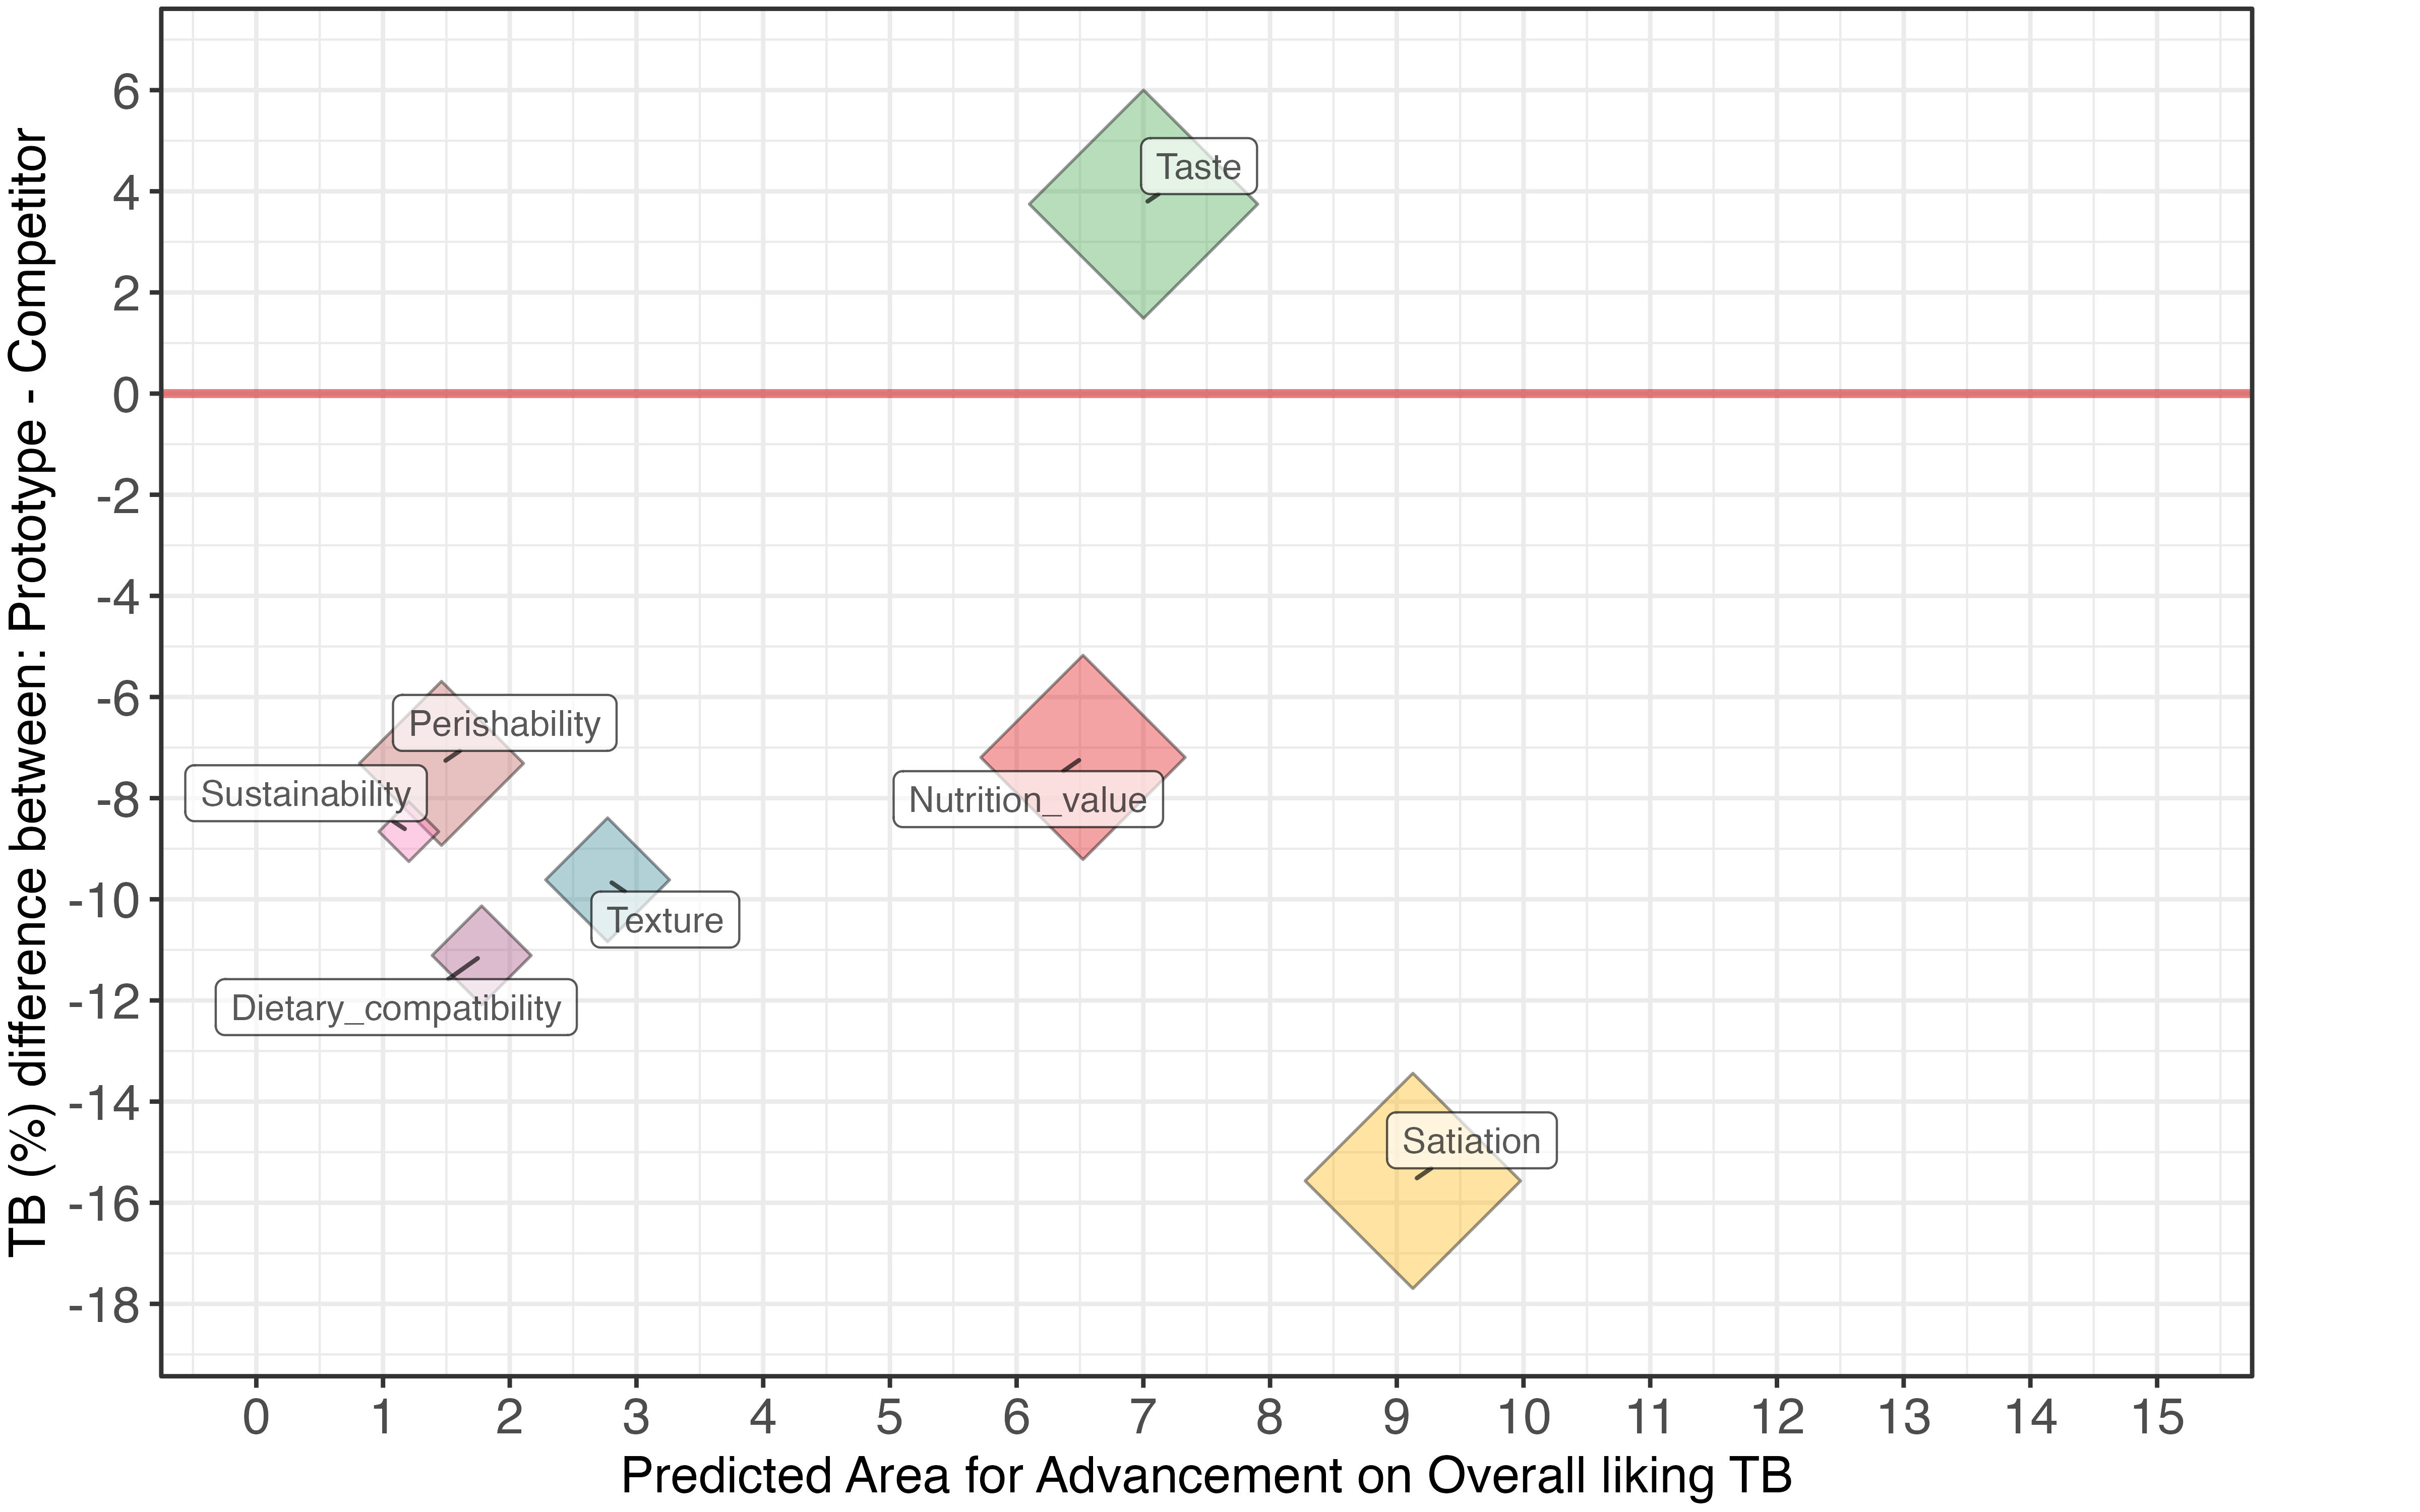
The graph offers valuable insights to guide the company in its research and development efforts aimed at improving the prototype. The y-axis displays the gap, defined as the difference in TB percentage between the prototype and the competitor for each cluster represented by a diamond. Each diamond corresponds to a significant cluster identified through the application of Model2. Additionally, the red line divides the graph into two distinct sections: the upper part emphasizes the prototype's weaknesses, while the lower part highlights its strengths. By analysing the graph, it's evident that the competitor received a higher percentage of TB responses in the area of taste, highlighting this as a key weakness for the prototype. In fact, the competitor outperformed the prototype by 3.6% in this aspect. However, the prototype is viewed more favourably by consumers across several other areas: perishability shows a 7.3% lead, nutrition value by 7.2%, sustainability by 8.8%, texture by 9.6%, dietary compatibility by 11.2%, and most notably, satiation, with a 15.5% higher TB response, making it one of the prototype's standout strengths.
At this point, it becomes crucial for the company to understand which aspects to prioritize in order to improve the prototype and pursue a path towards superiority over the competitor. To achieve this, predicting the areas for advancement is essential, as this measure provides insights into how improvements in specific aspects could lead to an increase in the TB percentage of overall liking. Essentially, this prediction answers the key question: what would happen to the TB percentage of overall liking if a particular cluster of drivers were improved? This information guides the company in making targeted enhancements to the prototype.
The x-axis of the graph provides exactly this indication, showing the potential impact that enhancing certain aspects of the prototype may have on increasing overall liking, guiding the company toward targeted improvements in key areas.
Finally, the size of the diamond is proportional to the variable importance for overall liking (values shown in Figure 1).
Regarding the area for advancement on overall liking TB, we can see that the critical aspect for our prototype, namely taste, has a high variable importance (i.e., receiving a TB response instead of other evaluations here has a significant impact on the likelihood of obtaining a TB response for the KPI overall liking) and a considerable area for improvement. Enhancing this aspect of the prototype is expected to lead to a 7% increase in TB for overall liking.
However, improving this aspect is not the only strategy available to the company. Another option is to further enhance aspects that are already perceived as stronger in the prototype. For instance, the prototype currently has a higher TB percentage for satiation compared to the competitor. Given its significant variable impact and substantial area for advancements, enhancing this feature could potentially result in a 9% increase in the TB percentage related to overall liking. Alternatively, improving the nutrition value aspect, which is already a better aspect of the prototype and has a notable variable importance, is expected to result in a 6.5% increase in the TB percentage for overall liking.
However, improvements in other aspects, such as the cream's texture, dietary compatibility, sustainability, and perishability, are expected to lead to an increase in the TB percentage for overall liking of less than 3%.
From this second part of the analysis, we can conclude that it provides an overview of the perception of the prototype and the competitor concerning various aspects. In particular, the prototype receives a high percentage of top ratings for many features, including satiation, dietary compatibility, and texture of the cream among others, while taste is regarded as a winning aspect for the competitor. The graph helps outline a roadmap that assists the company in planning its upcoming research and development activities aimed at improving the prototype and pursuing the path to superiority.
A strategy to achieve a higher percentage of TB ratings for overall liking could involve improving the taste, which is perceived as a strong aspect of the prototype. Alternatively, the company could focus on enhancing features that are already viewed favourably in the prototype, particularly those with high variable importance and considerable predicted areas for advancement in overall liking.
However, improving multiple aspects necessitates a careful evaluation of the trade-off between the predicted benefits of these enhancements and the financial investment required to implement them. Balancing these factors will be crucial in determining the most effective approach to maximizing overall customer satisfaction, although this analysis is outside the scope of the current case study.
4. Integration with Generative AI
The global e-commerce landscape has experienced a significant transformation in recent years, with online shopping becoming a central aspect of daily life for millions of consumers. With the rapid expansion of e-commerce platforms and the increasing amount of user-generated content, there is a significant opportunity to create analytical tools capable of efficiently processing and deriving meaningful insights from this vast array of data. In particular, greater emphasis should be placed on integrating the proposed machine learning-based methodology to fully leverage this information, enabling businesses to better understand consumer behaviour and enhance their competitive strategies.
The combination of web scraping techniques and natural language processing models is essential for making online review data accessible for analysis, allowing for appropriate sentiment analysis techniques to be applied. In particular, aspect-based sentiment analysis conducted on this textual data can effectively extract relevant aspects and associated sentiments. These insights provide valuable interpretations, revealing additional product features that should be considered during the product development phase, as they have proven to be important for consumers. Furthermore, integrating this approach with the previously described methodology can enhance the understanding of customer preferences, leading to more targeted product improvements and marketing strategies. It also allows businesses to quickly adapt to emerging trends, ultimately driving customer satisfaction and loyalty.
5. Conclusion
This paper emphasizes the importance of understanding and analysing customer satisfaction for businesses which aim to succeed in today’s competitive landscape. In particular, the paper introduces an innovative machine learning-based tool designed for analysing customer satisfaction data, providing companies with an effective way to identify the key groups of drivers that influence customer satisfaction.
One of the challenges in consumer data analysis lies in the fact that customer satisfaction is often measured across various product features, many of which may relate to the same broader aspect. This overlap makes it difficult to accurately determine the impact that a specific product feature has on overall customer satisfaction. As a result, understanding the impact of specific aspects on overall satisfaction can become complex. To overcome this challenge, we propose clustering the drivers using a suitable hierarchical clustering algorithm. This approach helps clarify the combined influence of these aspects on overall satisfaction, providing a clearer picture of their collective impact.
The proposed methodology introduces an approach by integrating multiple machine learning models. By selecting the best-performing model for each specific scenario, this approach effectively tackles data variability while improving predictive accuracy, as demonstrated by cross-validated AUC measures. Overall, this machine learning tool serves as a valuable resource during the product development phase, helping businesses enhance their competitive position in the market. Moreover, by understanding what drives satisfaction, companies can create offerings that not only fulfil market demands but also enhance overall customer satisfaction, ultimately leading to greater customer loyalty and business success.
This article presents the application of the methodology to a real case study, demonstrating its practical relevance and effectiveness in analysing customer satisfaction.
Future initiatives will prioritize the integration of generative AI to improve the monitoring of customer satisfaction through the analysis of online consumer reviews. By employing aspect-based sentiment analysis on these reviews, we aim to uncover emerging factors affecting customer satisfaction that may need further exploration and enhancement. This approach will enable companies to stay responsive to evolving consumer preferences and adapt their strategies accordingly.
References
[1] Cengiz, E. (2010). Measuring customer satisfaction: must or not. Journal of naval science and engineering, 6(2), 76-88.
[2] Yeung, M. C., & Ennew, C. T. (2000). From customer satisfaction to profitability. Journal of strategic marketing, 8(4), 313-326 View Article
[3] Bhat, S. A., & Darzi, M. A. (2019). Exploring the influence of consumer demographics on online purchase benefits. FIIB Business Review, 8(4), 303-316. View Article
[4] Ming, G. (2022). Application research of customer big data analysis for online shop based on smart cloud platform tools. In 2022 IEEE 2nd International Conference on Power, Electronics and Computer Applications (ICPECA) (pp. 1142-1145). IEEE View Article
[5] Haslinah, A., Mutmainnah, A., & Jalil, I. Z. (2023). Product development analysis of dragon fruit praline chocolate by using Quality Function Deployment (QFD) method. In AIP Conference Proceedings (Vol. 2595, No. 1). AIP Publishing. View Article
[6] Westbrook, R. A., & Oliver, R. L. (1981). Developing Better Measures of Consumer Satisfaction: Some Preliminary Results. ACR North American Advances, NA-08
[7] Dabholkar, P. A., Thorpe, D. I., & Rentz, J. O. (1996). A measure of service quality for retail stores: scale development and validation. Journal of the Academy of marketing Science, 24, 3-16. View Article
[8] Goode, M., & Moutinho, L. (1996). The effects of consumers age on overall satisfaction: An application to financial services. Journal of Professional Services Marketing, 13(2), 93-112. View Article
[9] Patterson, P. G. (1993). Expectations and product performance as determinants of satisfaction for a high‐involvement purchase. Psychology & Marketing, 10(5), 449-465 View Article
[10] Spreng, R. A., MacKenzie, S. B., & Olshavsky, R. W. (1996). A reexamination of the determinants of consumer satisfaction. Journal of marketing, 60(3), 15-32. View Article
[11] Fournier, S., & Mick, D. G. (1999). Rediscovering satisfaction. Journal of marketing, 63(4), 5-23. View Article
[12] Meuter, M. L., Ostrom, A. L., Roundtree, R. I., & Bitner, M. J. (2000). Self-service technologies: understanding customer satisfaction with technology-based service encounters. Journal of marketing, 64(3), 50-64. View Article
[13] Kumar, S., & Zymbler, M. (2019). A machine learning approach to analyze customer satisfaction from airline tweets. Journal of Big Data, 6(1), 1-16. View Article
[14] Tama, B. A. (2015). DATA MINING FOR PREDICTING CUSTOMER SATISFACTION IN FAST-FOOD RESTAURANT. Journal of Theoretical & Applied Information Technology, 75(1)
[15] Imtiaz, M. N., & Ben Islam, M. K. (2020). Identifying significance of product features on customer satisfaction recognizing public sentiment polarity: Analysis of smart phone industry using machine-learning approaches. Applied Artificial Intelligence, 34(11), 832-848. View Article
[16] Li, H., Liu, Y., Tan, C. W., & Hu, F. (2020). Comprehending customer satisfaction with hotels: Data analysis of consumer-generated reviews. International Journal of Contemporary Hospitality Management, 32(5), 1713-1735. View Article
[17] Zhao, Y., Xu, X., & Wang, M. (2019). Predicting overall customer satisfaction: Big data evidence from hotel online textual reviews. International journal of hospitality management, 76, 111-121. View Article
[18] Barzizza, E., Campbell, S., Ceccato, R., Dobosz, A., Haag, M., Martins, R., & Salmaso, L. (2024). A Data-Driven Approach to Understanding Customer Satisfaction. Journal of Machine Intelligence and Data Science, 5, 1-7 View Article
[19] Jones, T. O., & Sasser, W. E. (1998). Why satisfied customers defect. IEEE Engineering Management Review, 26(3), 16-26.
[20] Morgan, Neil A., & Lopo Leotte Rego. «The value of different customer satisfaction and loyalty metrics in predicting business performance». Marketing science, vol. 25, fasc. 5, 2006, pp. 426-39. View Article
[21] Chavent, M., Kuentz, V., Liquet, B., & Saracco, L. (2011). ClustOfVar: An R package for the clustering of variables. arXiv preprint arXiv:1112.0295. View Article