Journal of Machine Intelligence and Data Science (JMIDS)

Volume 5 - Year 2024 - Pages 82-93
DOI: 10.11159/jmids.2024.010
Evaluation of the Impact of 3D Scanning and Photogrammetry Methods on Anthropometric University Practices: A Case Study
Tyzon Javier García Flores1, Paola Michelle Pascua Cantarero1
1Facultad de Ingeniería, Universidad Tecnológica Centroamericana (UNITEC Honduras)
Distrito Central, Tegucigalpa, Honduras
tyzongarcia@unitec.edu; paola.pascua@unitec.edu.hn
Abstract - At UNITEC Tegucigalpa, it was observed that, during anthropometry laboratory practices, body measurements were obtained from the subjects measured using traditional methods, where the measurers took the measurements in various ways. This variability caused fatigue in both the students being measured and the measurers, resulting in delays in obtaining results. Consequently, these results could have some degree of alteration, which was not conducive to the classroom activity. The objective was to analyze improvements in the methodology for taking anthropometric measurements through alternative measurement methods, with the participation of 14 students from the Methods Engineering I class. It was found that the photogrammetry method offered greater reliability (AE = -0.40 cm) compared to the 3D scanning method (AE = +4.19 cm). The photogrammetry method had the highest percentage of activity by the measuring student, reaching 100%, and reduced the time by 32.16% (average percentage relative error with AE = -8.13 min) compared to the traditional method. On the other hand, the 3D scanning method resulted in a greater idle time for the measurer, accounting for 78.82% (7.79 minutes) of the total time. The main contribution of this research was to analyze the advantages and disadvantages in terms of time, accuracy, cost and handling of the capturing technologies when using both alternative methods in a university anthropometric practice scenario.
Keywords: Anthropometry, Photogrammetry, Fatigue, 3D scanning, Absolute error.
© Copyright 2024 Authors - This is an Open Access article published under the Creative Commons Attribution License terms. Unrestricted use, distribution, and reproduction in any medium are permitted, provided the original work is properly cited.
Date Received:2023-12-22
Date Revised: 2024-09-24
Date Accepted: 2024-10-01
Date Published: 2024-10-15
1. Introduction
The issue addressed in this article pertained to the anthropometry laboratory practices, where body measurements were obtained from the subjects using traditional methods. Measurers employed various techniques, leading to variability that caused fatigue for both the students being measured and the measurers. This variability also resulted in delays in obtaining results, and consequently, these results could have been altered to some extent, which was not conducive to the class activity. The overarching objective was to analyze improvements in the methodology for taking anthropometric measurements during the practice sessions at the Industrial and Systems Engineering Laboratory of UNITEC Honduras. This was achieved through the application of alternative methods such as 3D scanning and photogrammetry, utilizing Engineering Methods. Three specific objectives were outlined: firstly, anthropometric measurements were conducted with students from the Methods Engineering I class, who had limited expertise in body measurements. This involved comparing the traditional method with alternative methods to identify enhancements in the laboratory practice. The evaluation was based on the standard anthropometric technique, principles of work design, and 23 anthropometric measurements specified in the class guide.
In the second objective, the activity and inactivity times during the anthropometric measurements of the subjects were compared using both the traditional method and alternative methods, with measurements conducted utilizing the multiple activity diagram. In the third objective, it was validated that the methodology employed in the current investigation, encompassing both traditional and alternative methods, adhered to good practices. This validation was achieved through piloting, inferential statistical analysis utilizing the paired T-test (for anthropometric measurements and total measurement time), and triangulation by experts.
In relation to this problem, similar studies were found. In the Netherlands, in 2011, a study was conducted on the evaluation of anthropometric precision and reliability using three different three-dimensional scanning systems: Minolta Vivid 900, CBCT, and Di3D; subsequently, they were compared with physical linear measurements. All 3D scanning systems proved to be highly reliable (ICC > 0.923-0.999) compared to physical measurements (ICC; 0.964-0.999). Only one CBCT measurement and one Di3D measurement had a mean absolute error of more than 1.5 mm [1].
Meanwhile, in Switzerland, a study was conducted in 2017 comparing 3D laser-based photonic scans and manual anthropometric measurements of height and waist, hip, buttock, and chest circumferences twice for each of the 123 young Swiss participants. The Vitus Smart XXL body scanner was used, and the means between both techniques were compared, revealing significant differences: height was lower by 2.1 cm; while waist, hip, and bust circumference measurements were greater in the scans by between 1.17 and 4.37 cm [2].
At the regional level, in Mexico, a study was carried out in 2016 on the development of a program for anthropometry through photogrammetry. A reduction in time of 53% and cost of 97% was obtained, with photogrammetric technique proving to be the one that reached the lowest time and cost for obtaining anthropometric measurements [3].
In Honduras, there has been a recent interest in establishing appropriate anthropometric measures for work studies, alongside the examination of various measurement techniques. These studies highlight the importance of considering the unique ethnic characteristics of the population being studied [4].
This article will consist of the following sections: the first, the introduction, where the definition of the problem, some international and regional background, and the objectives (general and specific) will be presented; in the second section, the methodology will be described, where the approach, scope, population, sample, analyzed variables, instruments, and applied techniques will be presented; in the third section, the results and analysis obtained from each specific objective will be shown; in the fourth section, the discussions; and the fifth section, the global conclusion.
2. Methodology
2.1. Focus and scope
For this study, the quantitative approach was employed as the studied phenomena (anthropometric measurements and time) could be measured [5]. Data were collected, and statistical analyses were conducted to identify behavioral patterns in the obtained body measurements and the recorded time [6]. The scope of this study aligned with descriptive research, where the anthropometric measurements of the participants in the involved sample and the presented procedures were analyzed [6].
2.2. Focus and scope
The finite population identified for this study was the 14 students (6 men and 8 women) from the Methods Engineering I class of the Industrial and Systems Engineering degree at UNITEC Tegucigalpa campus during the IV academic period (October-December 2023). The sampling techniques used in this study were as follows: simple random probabilistic sampling to determine the total sample of participants (14 students); additionally, non-probability convenience sampling was employed to establish the number of available student meters [7] who used the Blender measurement software and the mobile application, as explained in the following paragraph.
The study was divided into stages. In stage 1 of the alternative 3D scanning method and photogrammetry, a sample of 9 students (out of the total 14) was defined who volunteered to act as scanners or photographers of the students measured through the Skanect scanning program and the ImageMeter mobile application. In stage 2 of both alternative methods, 5 of the 9 students mentioned above played the role of student meters, participating in the measurement stage using the Blender and ImageMeter programs. The remaining 4 students could not participate due to time limitations and schedule discrepancies with the researcher.
2.3. Variables analyzed
The research variables were the following shown in Table 1:
Table 1. Variables analyzed
|
23 Anthropometric Measurements from the Anthropometry Laboratory Guide |
|
|
A |
Vertical reach |
|
B |
Height |
|
C |
Height of the eyes to the ground |
|
D |
Height of the elbows to the ground |
|
E |
Reach of the arm in front |
|
I |
Length of the foot |
|
J |
Head width |
|
K |
Shoulder width |
|
L |
Hip width |
|
M |
Elbow to elbow distance |
|
N |
Head length |
|
O |
Height from seat |
|
P |
Eye height to seat |
|
Q |
Shoulder height to seat |
|
R |
Resting elbow height to seat |
|
S |
Free thigh height |
|
T |
Distance from knee to floor |
|
U |
Seat length |
|
V |
Buttock-knee distance |
|
W |
Bottom height of the leg |
|
X |
Foot buttock distance |
|
Y |
Leg buttock length |
|
Z |
Hand forearm length |
Source: Own elaboration
The variables mentioned above were 23 anthropometric measurements—essential determinants of ergonomic conditions [8]—according to the guide of the Anthropometry Laboratory of the subject of Engineering Methods I. This guide contained 26 anthropometric measurements, of which 3 were not considered for this research: chest circumference (F), waist circumference (G) and hip circumference (H). The main reason they were not included in this study was because the measurement software Blender and the mobile application ImageMeter did not have a tool that could take measurements of curved surfaces.
2.4. Instruments and applied techniques
To achieve the objectives outlined in specific objective 1, the following measurement instruments were used in the traditional method: anthropometers, movable wooden stops for anthropometric measurement, and measuring tapes. For the alternative 3D scanning method, a Kinect v1 sensor was required to capture 3D meshes, along with the Skanect scanning software and the Blender measurement program. In the alternative photogrammetry method, the ImageMeter mobile application was utilized to obtain images and measurements.
To accomplish specific objective 2, a stopwatch was employed to measure the duration of each proposed method. For data tabulation, the multiple activity diagram was used to graphically illustrate the recording of the respective activities of various study objects (measurers and measurement programs simultaneously) on a common time scale to show the correlation between them [9]. Paired T-test analysis was employed to study the estimation procedures for the difference of two means when the samples are not independent, and the variances of the two populations are not necessarily equal [10].
For specific objective 3, the inferential statistical technique of the paired T-test was utilized to compare the anthropometric measurements obtained by the measuring students in each of the alternative methods with respect to the traditional method; additionally, validation with triangulation by experts was required. Microsoft Excel was used for the respective analyses in each of the three proposed objectives.
3. Results and analysis
3. 1. Anthropometric measurements using the standard anthropometric technique and work design principles
3. 1. 1. Traditional method
Anthropometry is a collection of direct quantitative measurements of the external dimensions of the human body, which can be used as indirect indicators of body composition [11]. The traditional method of direct measurement is based on determining the depths, heights, and widths of different parts of the human body from anatomical points established with measuring instruments [12]. Prior to obtaining the final anthropometric measurements using the traditional method, a pilot project was conducted to identify areas for improvement in the measurement process using physical measurement instruments (anthropometers, measuring tapes, and movable wooden stops for anthropometric measurement). The movable wooden stops served as reference points for conducting anthropometric measurements.
Following the pilot project, the need to prepare the students with essential instructions became apparent (through three brief briefings in each of the three methods), as the 14 students were divided into three groups (two groups of five members and one group of four) on different days (two days), with the aim of achieving better results in the final measurements through a comprehensive explanation of the method. To carry out the practice that would yield the official results, the most suitable measurement method identified during the pilot project was applied: three measurers taking measurements of two postures for the same student until the measurement process was completed.
The design of the work allows for analyses to be conducted that minimize work-related injuries [13]. The work design principles identified in the traditional method were as follows in Table 2:
Table 2. Work design principles identified in the Traditional Method applied to the measured student or measurer
|
Work design principles identified in the Traditional Method |
|||
|
Identified principle |
Measured student |
Measurer |
|
|
1 |
Provide a comfortable chair for the operator |
✔ |
|
|
2 |
Offer seat adjustability |
✔ |
|
|
3 |
Place all tools and materials within the normal work area |
|
✔ |
|
4 |
Arrange tools and materials to allow for the best sequence |
|
✔ |
Source: Own elaboration
3. 1. 2. Alternative 3D scanning method
Prior to taking the official anthropometric measurements of the alternative 3D scanning method, as in the traditional method, a pilot study was carried out to identify points of improvement. As a result of the piloting, 3 final postures were proposed as described below:
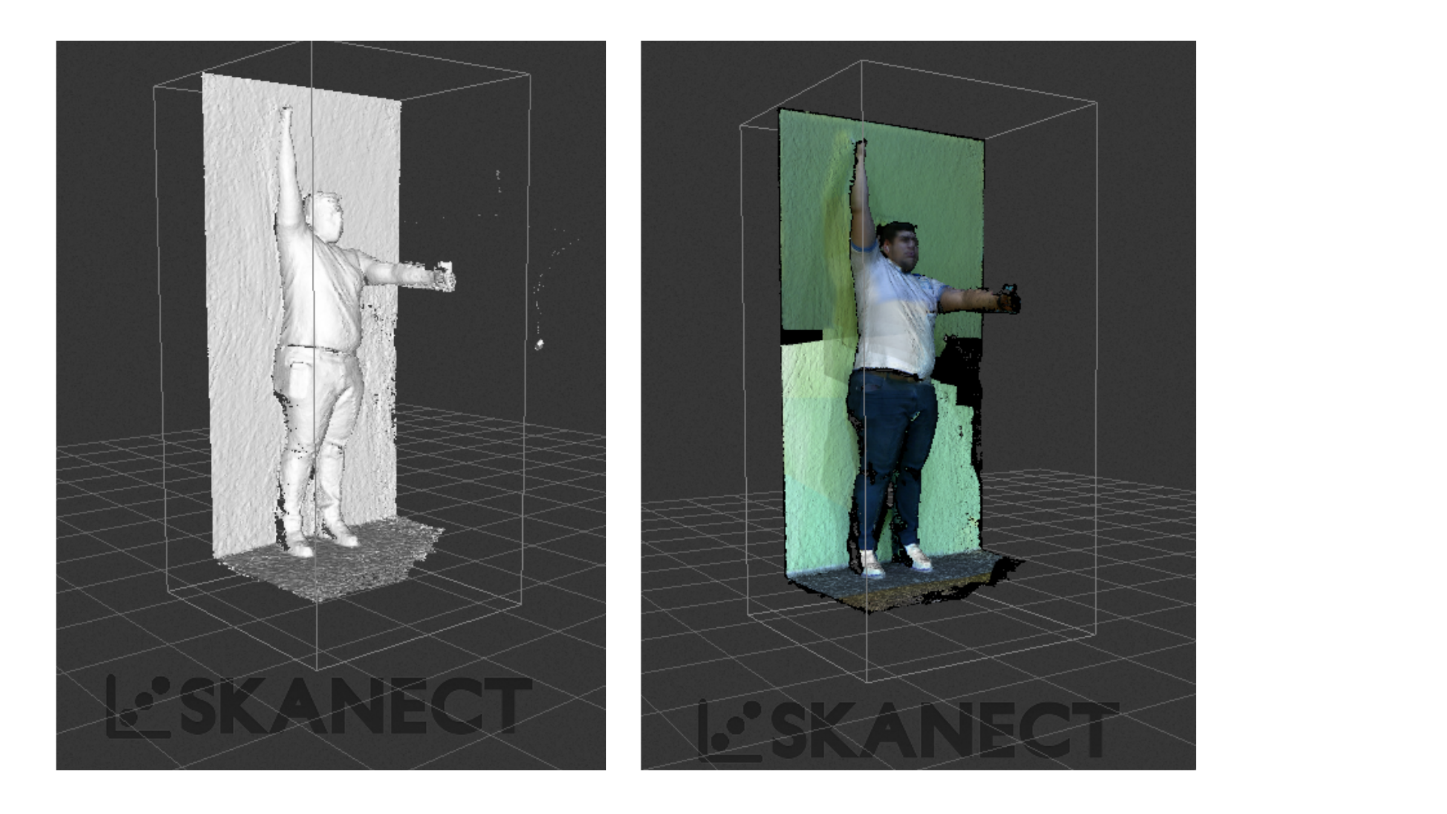
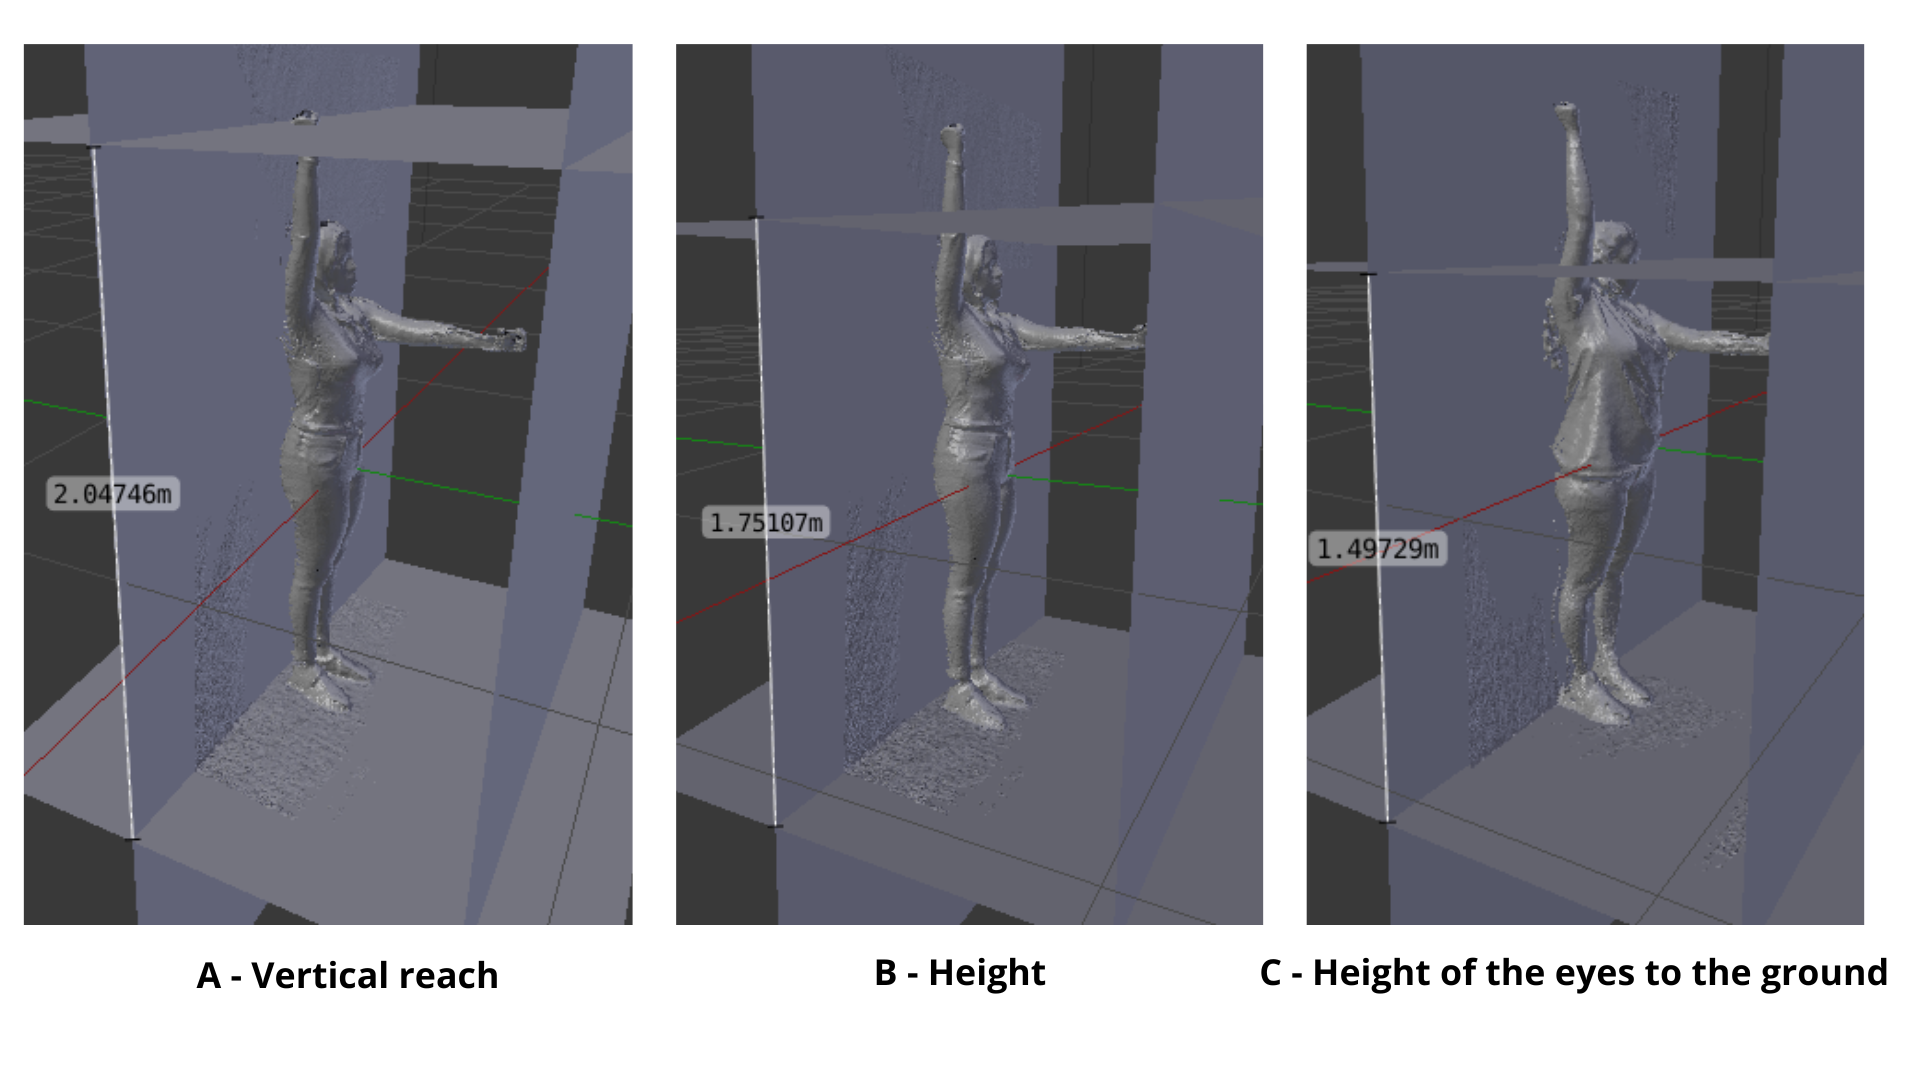
1) first posture, in a standing position aligned to the wall with the right arm extended upward and the left arm extended forward (Figure 1):
2) second posture, in a standing position aligned to the wall with the elbows at 90 degrees (Figure 2):
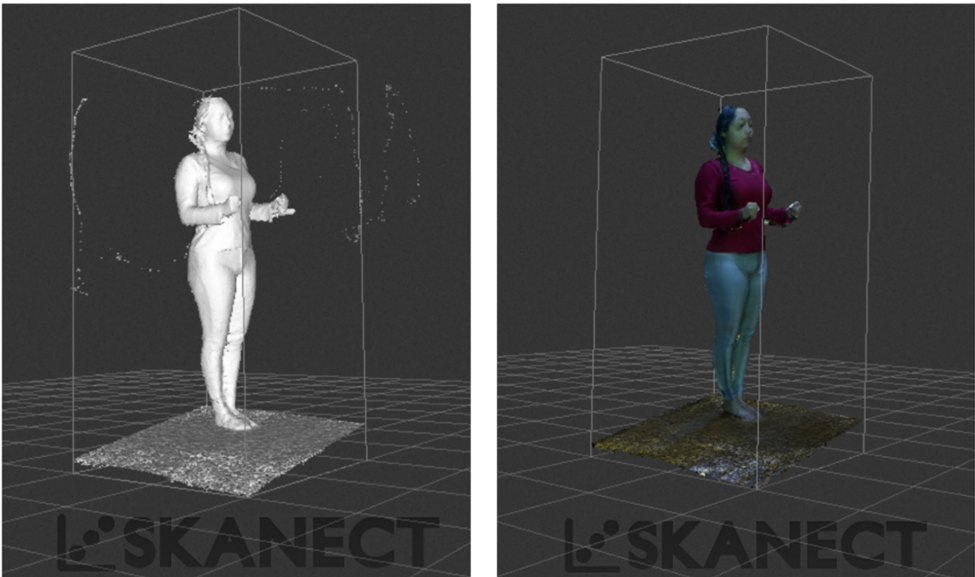
2) second posture, in a standing position aligned to the wall with the elbows at 90 degrees (Figure 2):
After the piloting, 3 short socializations were carried out with a duration between 15 to 25 minutes, where the usefulness and correct use of the anthropometric measurement instruments to be used were explained to each group (Kinect sensor, Skanect scanning program and the Blender measurement). This method was carried out in 2 stages:
3. 1. 2. 1. Stage 1: 3D mesh capture via scanning in the alternative scanning method
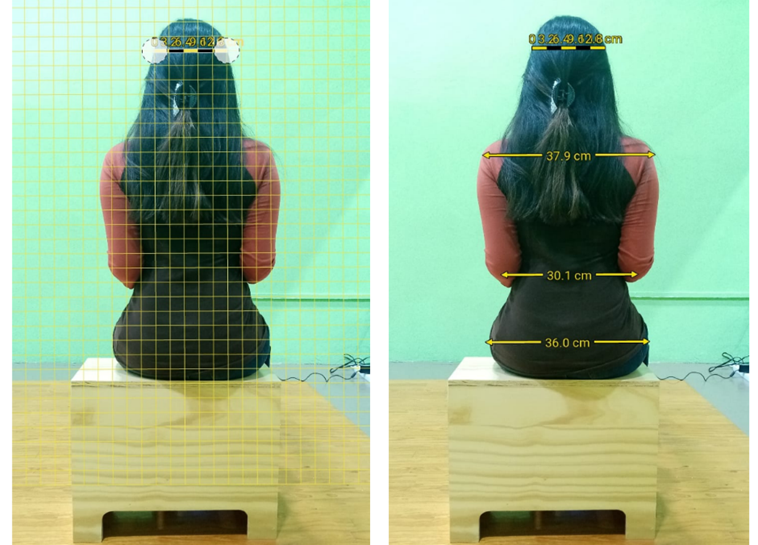
Stage 1 consisted of scanning the 14 students from the Methods Engineering I class. In this method, the following instruments were needed: Kinect v1 sensor and the Skanect scanning program (Figure 4).
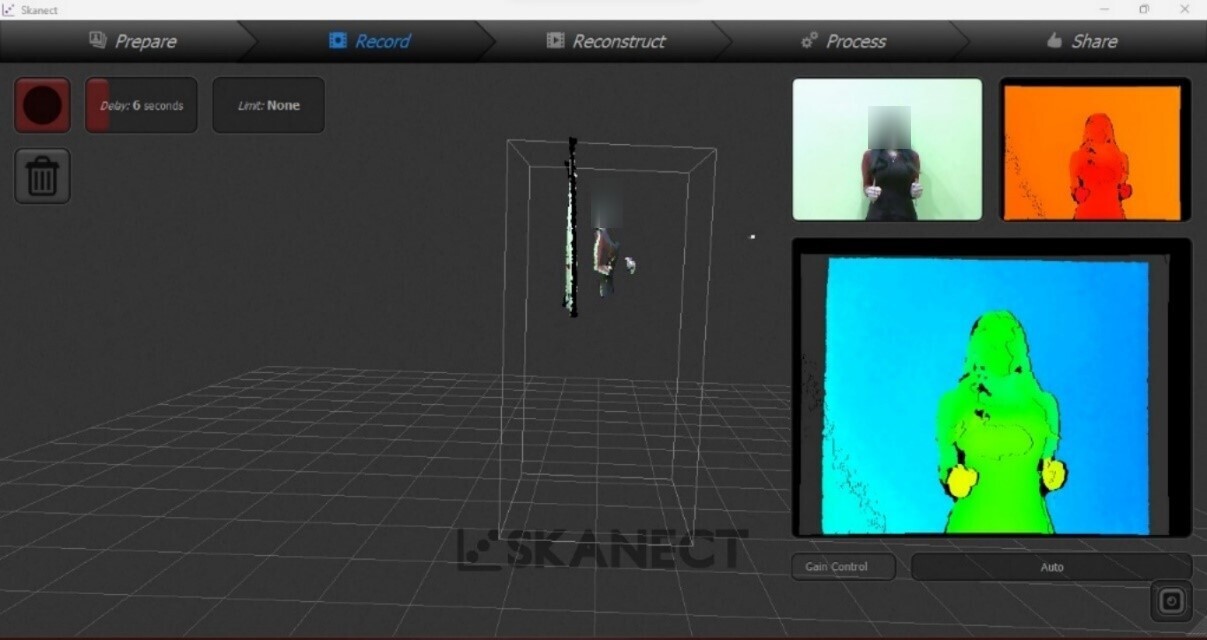
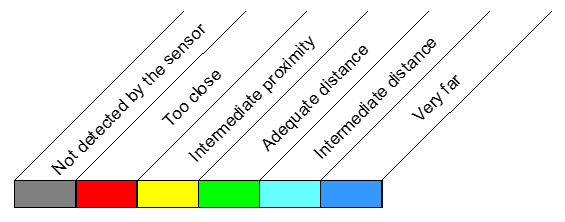
In the Figure 5, the meaning of the color is indicated according to the distance (inadequate or adequate) between the measured student and the Kinect sensor held by the measurer:
The 3D scanners have the next advantages: performing several measurements in a short time, manipulation of the individual is minimal, there is precision and fidelity of the results. However, there is a need to train personnel to use the equipment, and such equipment can be expensive [14].
3. 1. 2. 2. Stage 2: Anthropometric measurements via Blender in the alternative method of 3D scanning
Once the scanning of all the 14 students participating in this study was completed, their anthropometric measurements were taken through the Blender program in stage 2 as shown in Figure 6:
The additional work design principles that were identified in the 3D scanning method were the following in Table 3 (including those shown in the traditional method):
Table 3. Work design principles identified in the 3D Scanning Method applied to the measured student or measurer
|
Work design principles identified in the 3D Scanning Method |
|||
|
Identified principle |
Measured student |
Measurer |
|
|
1 |
Provide a comfortable chair for the operator |
✔ |
|
|
2 |
Offer seat adjustability |
✔ |
|
|
3 |
Adjust the height of the work surface based on the task being performed |
✔ |
|
|
4 |
Place all tools and materials within the normal work area |
|
v |
|
5 |
Arrange tools and materials to allow for the best sequence |
|
✔ |
|
6 |
Promote postural flexibility |
✔ |
✔ |
Source: Own elaboration
3. 1. 3. Alternative photogrammetry method
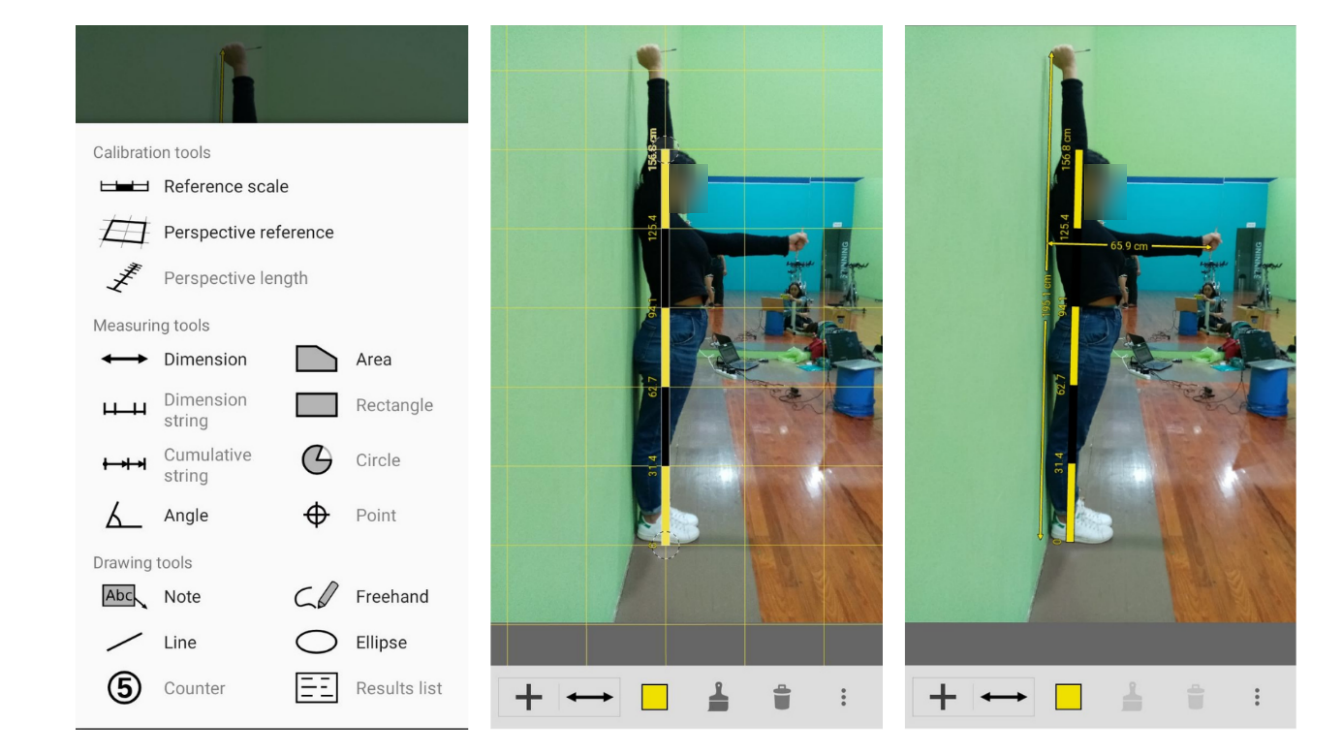
Prior to taking the final anthropometric measurements of the alternative photogrammetry method, a pilot study was carried out to identify points of improvement. Subsequently, 3 short socializations were held with a duration between 10 and 15 minutes each, where the usefulness of the ImageMeter mobile application was explained to each group and the “reference scale” was shown to take anthropometric measurements from an already known dimension. This method was carried out in 2 stages:
3. 1. 3. 1. Stage 1: Taking pictures of the alternative photogrammetry method
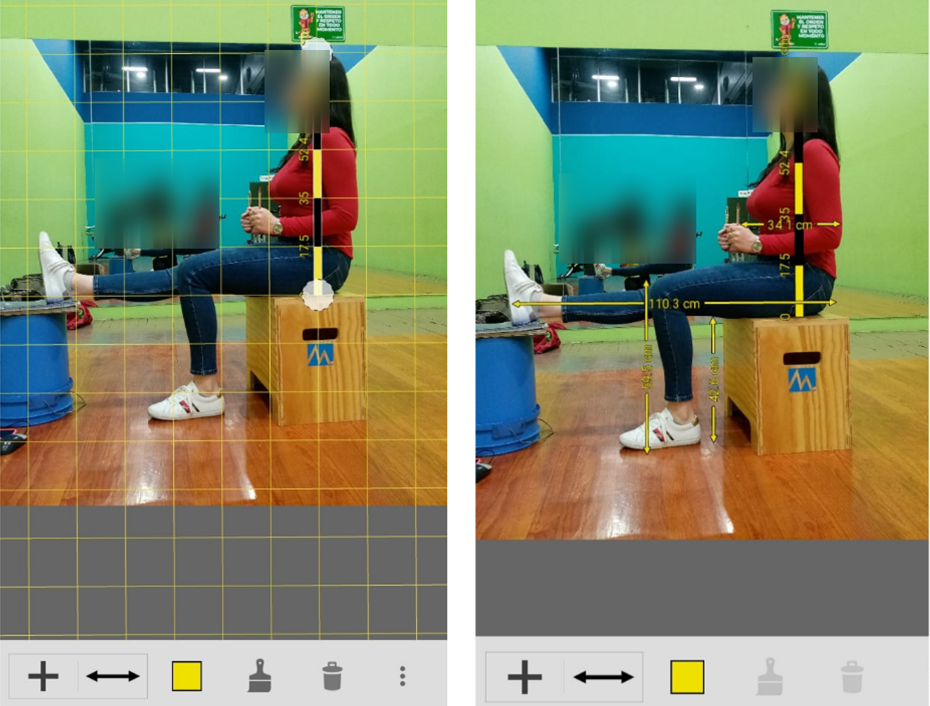
To obtain these measurements, the photogrammetry method was used, which consisted of taking the measurement of an object, through photographs [15]. In this alternative method, the physical presence of the person is no longer necessary for the process of taking measurements and can be done at any time [14]. Stage 1 consisted of taking photographs of the 14 participants. As a result of the piloting, 4 final postures were proposed as described below:
1) first posture, in a standing position with the back aligned to a wall, with the right arm extended upward and the left arm extended forward (Figure 7):
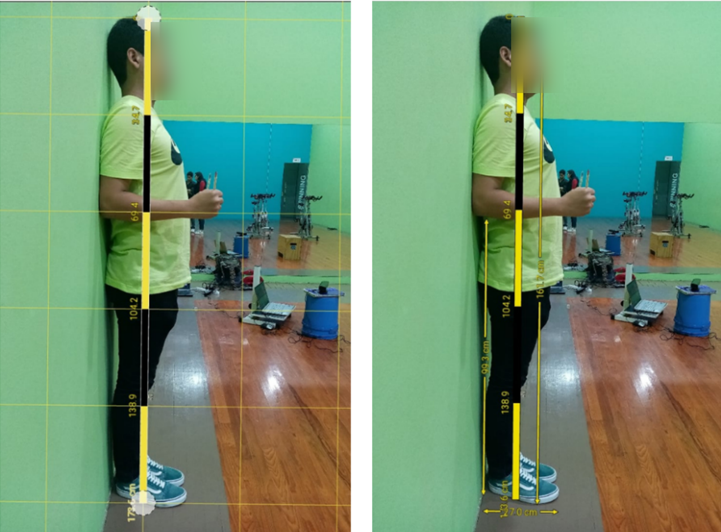
2) second posture, in a standing position with the back aligned to a wall with the elbows at 90 degrees (Figure 8).
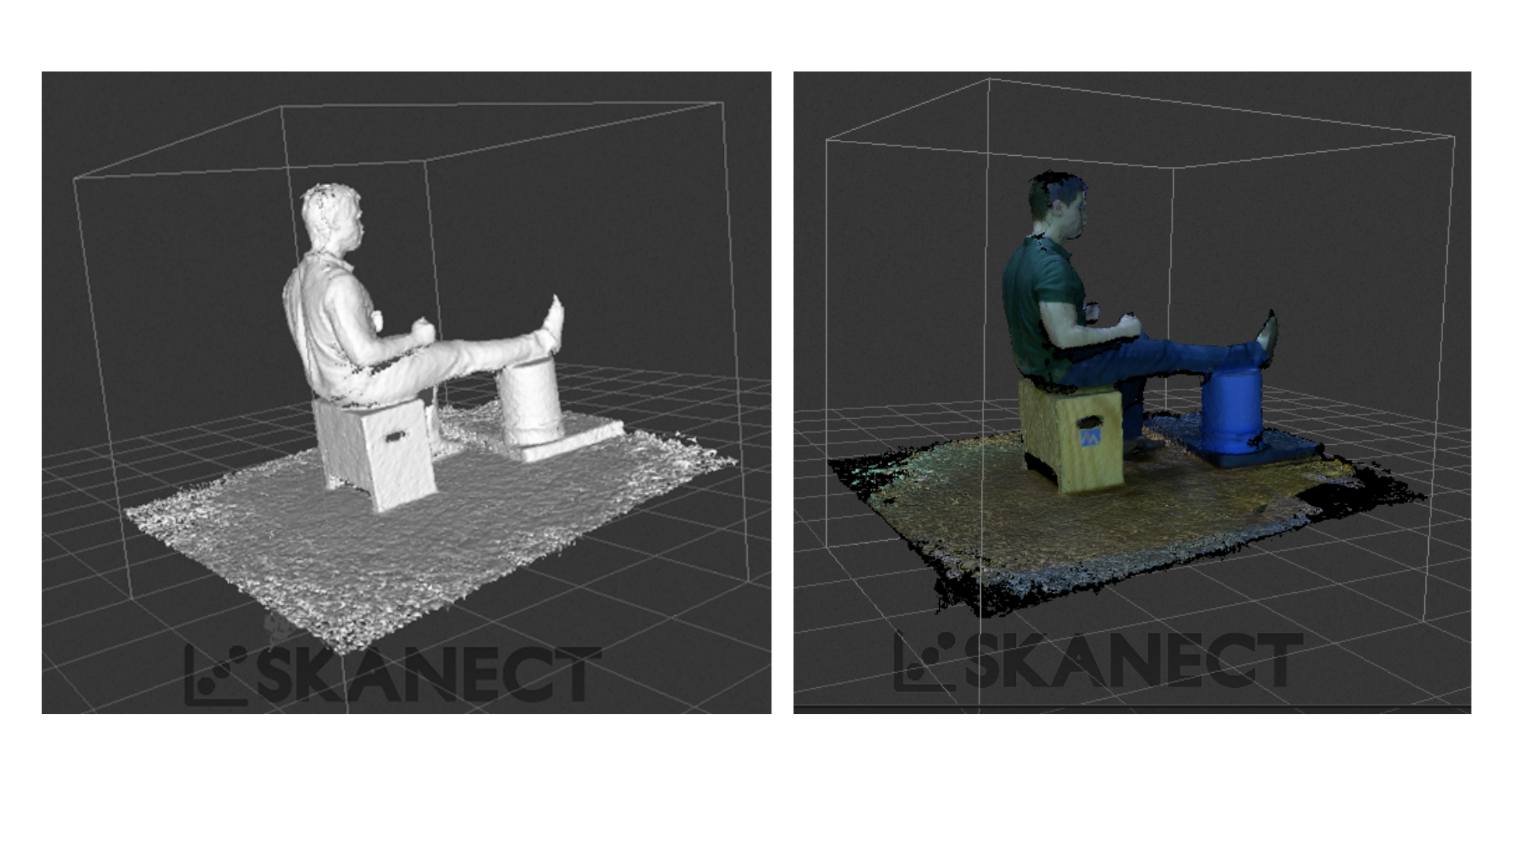
3) third posture, in a sitting position with the back upright without leaning against a wall, the right foot extended parallel to the floor supported on a bench or footrest, the left foot with the knee bent at 90 degrees, the elbows at 90 degrees close to the body and looking forward (Figure 8):
4) and fourth posture, in a sitting position with the back upright without leaning on a wall, looking forward and elbows close to the body (Figure 9):
3. 1. 3. 2. Stage 2: Anthropometric measurements via ImageMeter
Once the photographs of all the 14 students participating in this study were completed, their anthropometric measurements were taken through the ImageMeter mobile application in stage 2. It is necessary to mention that height (B), head width (J) and height from the seat (O) in this method were used as “reference scales” taken from the measurements made in the traditional method; therefore, since they are already known dimensions, they were not considered within the analysis of this method.
The work design principles identified in the alternative photogrammetry method were the same ones identified in the alternative 3D scanning method as shown in Table 4:
Table 4. Work design principles identified in the Photogrammetry Method applied to the measured student or measurer
|
Work design principles identified in the Photogrammetry Method |
|||
|
Identified principle |
Measured student |
Measurer |
|
|
1 |
Provide a comfortable chair for the operator |
✔ |
|
|
2 |
Offer seat adjustability |
✔ |
|
|
3 |
Adjust the height of the work surface based on the task being performed |
✔ |
|
|
4 |
Place all tools and materials within the normal work area |
|
✔ |
|
5 |
Arrange tools and materials to allow for the best sequence |
|
✔ |
|
6 |
Promote postural flexibility |
✔ |
✔ |
Source: Own elaboration
After knowing the anthropometric measurements of each alternative method, they were compared with the anthropometric measurements of the traditional method through the following tools: the relative percentage error, which is defined as the quotient between the EA and the exact value; and the absolute error (EA), which consists of the difference between the observed value (anthropometric measurements of the alternative 3D scanning method either photogrammetry) and its expected value (the anthropometric measurements of the traditional method) [16]. It was noted that the 3D scanning method had a higher average absolute error (+4.19 cm) compared to the photogrammetry method ( -0.40 cm). Below are the statistical data calculated from the results obtained from each of the 3 methods in Table 5, 6 and 7:
Table 5. Statistical data of the final anthropometric measurements obtained from men and women in the Traditional method (cm)
|
Statistical data of the final anthropometric measurements obtained from men and women in the Traditional method (cm) |
|||
|
Anthropometric measurement |
µ |
σ |
|
|
A |
Vertical reach |
196.81 |
9.79 |
|
B |
Height |
164.93 |
7.50 |
|
C |
Height of the eyes to the ground |
152.80 |
7.24 |
|
D |
Height of the elbows to the ground |
101.26 |
4.33 |
|
E |
Reach of the arm in front |
69.62 |
4.27 |
|
I |
Length of the foot |
27.29 |
1.79 |
|
J |
Head width |
15.45 |
0.75 |
|
K |
Shoulder width |
39.58 |
2.30 |
|
L |
Hip width |
38.72 |
3.72 |
|
M |
Elbow to elbow distance |
39.72 |
6.67 |
|
N |
Head length |
18.77 |
0.98 |
|
O |
Height from seat |
85.49 |
3.53 |
|
P |
Eye height to seat |
74.38 |
3.31 |
|
Q |
Shoulder height to seat |
56.30 |
2.09 |
|
R |
Resting elbow height to seat |
22.69 |
2.61 |
|
S |
Free thigh height |
16.13 |
2.16 |
|
T |
Distance from knee to floor |
51.71 |
2.92 |
|
U |
Seat length |
45.09 |
4.79 |
|
V |
Buttock-knee distance |
56.17 |
3.98 |
|
W |
Bottom height of the leg |
39.20 |
1.52 |
|
X |
Foot buttock distance |
71.86 |
4.18 |
|
Y |
Leg buttock length |
105.88 |
7.07 |
|
Z |
Hand forearm length |
25.26 |
2.22 |
Source: Own elaboration
Table 6. Statistical data of the final anthropometric measurements obtained from men and women in the 3D Scanning Method (cm)
|
Statistical data of the final anthropometric measurements obtained from men and women in the 3D Scanning Method (cm) |
|||
|
Anthropometric measurement |
µ |
σ |
|
|
A |
Vertical reach |
202.38 |
6.64 |
|
B |
Height |
170.47 |
4.77 |
|
C |
Height of the eyes to the ground |
158.48 |
4.84 |
|
D |
Height of the elbows to the ground |
107.67 |
4.36 |
|
E |
Reach of the arm in front |
70.84 |
4.91 |
|
I |
Length of the foot |
31.77 |
3.48 |
|
J |
Head width |
21.87 |
4.52 |
|
K |
Shoulder width |
44.97 |
4.20 |
|
L |
Hip width |
43.05 |
8.99 |
|
M |
Elbow to elbow distance |
47.03 |
8.82 |
|
N |
Head length |
25.79 |
5.18 |
|
O |
Height from seat |
87.13 |
2.40 |
|
P |
Eye height to seat |
74.17 |
2.23 |
|
Q |
Shoulder height to seat |
56.51 |
3.60 |
|
R |
Resting elbow height to seat |
22.63 |
2.88 |
|
S |
Free thigh height |
16.91 |
1.41 |
|
T |
Distance from knee to floor |
57.26 |
2.72 |
|
U |
Seat length |
49.34 |
5.51 |
|
V |
Buttock-knee distance |
63.08 |
5.58 |
|
W |
Bottom height of the leg |
43.90 |
1.71 |
|
X |
Foot buttock distance |
77.73 |
3.30 |
|
Y |
Leg buttock length |
110.82 |
3.22 |
|
Z |
Hand forearm length |
27.61 |
1.34 |
Source: Own elaboration
Table 7. Statistical data of the final anthropometric measurements obtained from men and women in the Photogrammetry Method (cm)
|
Statistical data of the final anthropometric measurements obtained from men and women in the Photogrammetry Method (cm) |
|||
|
Anthropometric measurement |
µ |
σ |
|
|
A |
Vertical reach |
203.08 |
13.59 |
|
B |
Height |
165.60 |
|
|
C |
Height of the eyes to the ground |
153.24 |
6.28 |
|
D |
Height of the elbows to the ground |
96.54 |
5.63 |
|
E |
Reach of the arm in front |
68.72 |
3.86 |
|
I |
Length of the foot |
27.62 |
1.27 |
|
J |
Head width |
15.26 |
|
|
K |
Shoulder width |
37.86 |
5.47 |
|
L |
Hip width |
37.22 |
4.82 |
|
M |
Elbow to elbow distance |
41.66 |
9.20 |
|
N |
Head length |
21.02 |
2.24 |
|
O |
Height from seat |
84.30 |
|
|
P |
Eye height to seat |
72.44 |
2.23 |
|
Q |
Shoulder height to seat |
57.20 |
2.11 |
|
R |
Resting elbow height to seat |
22.34 |
1.70 |
|
S |
Free thigh height |
19.32 |
3.53 |
|
T |
Distance from knee to floor |
54.28 |
2.03 |
|
U |
Seat length |
43.18 |
1.26 |
|
V |
Buttock-knee distance |
59.80 |
2.07 |
|
W |
Bottom height of the leg |
39.80 |
1.78 |
|
X |
Foot buttock distance |
68.26 |
3.49 |
|
Y |
Leg buttock length |
93.38 |
4.81 |
|
Z |
Hand forearm length |
24.20 |
0.79 |
Source: Own elaboration
3. 1. Uptime and downtime using the multiple activity diagram
3. 1. 1. Traditional method
Prior to making the aforementioned multiple activity diagram, time was clocked for each of the anthropometric measurements in this method. Three student measurers were required to intervene simultaneously to take anthropometric measurements of 1 student measured. The average total time per person in the traditional method was 21.35 min, with a CI = (19.36 min, 23.33 min). Below is a summary of the results obtained in Table 8:
Table 8. Average activity and inactivity times of measurers in the traditional method (min)
|
Average activity and inactivity times of measurers in the traditional method (min) |
|||
|
Measurer |
Function |
Activity times |
Inactivity times |
|
Measurer 1 |
Tape measurement metric or anthropometer |
AT (min) |
IT (min) |
|
21.01 |
0.34 |
||
|
AP (%) |
IP (%) |
||
|
98.43% |
1.57% |
||
|
Measurer 2 |
Use the movable wooden stops for anthropometric measurement |
AT (min) |
IT (min) |
|
12.21 |
9.14 |
||
|
AP (%) |
IP (%) |
||
|
57.20% |
42.80% |
||
|
Measurer 3 |
Alignment support for movable wooden stops and registration |
AT (min) |
IT (min) |
|
13.27 |
8.08 |
||
|
AP (%) |
IP (%) |
||
|
62.14% |
37.86% |
||
Source: Own elaboration
It was noted that the majority of the work was carried out by the measurer 1, who had a very low percentage of leisure (IP = 1.57%) compared to the other measurers.
3. 1. 1. 3D scanning method
Prior to making the aforementioned multiple activity diagram, the time for each of the activities was timed to take the anthropometric measurements of the 3D scanning method. During this method, 1 measuring student was required to take anthropometric measurements of 1 measured student. The average total time per person in the 3D scanning method was 36.77 min, with a CI = (34.35 min, 39.18 min). Below is a summary (Table 9) with the activity and inactivity times obtained:
Table 9. Activity and inactivity times in the 3D scanning method (min)
|
Average activity and inactivity times of the measuring student and the programs involved in the 3D scanning method (min) |
|||
|
Measurers |
Function |
Activity times |
Inactivity times |
|
Measurer |
Scan and measurement |
AT (min) |
IT (min) |
|
28.98 |
7.79 |
||
|
AP (%) |
IP (%) |
||
|
78.82% |
21.18% |
||
|
Skanect Software (Stage 1) |
Projection of image to scan |
AT (min) |
IT (min) |
|
16.97 |
0 |
||
|
AP (%) |
IP (%) |
||
|
100% |
0% |
||
|
Blender Software (Stage 2) |
Measurement |
AT (min) |
IT (min) |
|
19.8 |
0 |
||
|
AP (%) |
IP (%) |
||
|
100% |
0% |
||
Source: Own elaboration
The average time in which stage 1 was carried out was 16.97 minutes. It should be noted that, in this stage, the measured students and the measurer participated. However, for stage 2, only the measuring student was counted, in an average time of 19.80 minutes.
3. 2. 3. Photogrammetry method
Prior to making the aforementioned multiple activity diagram, the time for each of the activities was timed to take the anthropometric measurements of the photogrammetry method. During this method, 1 measuring student was required to take anthropometric measurements of 1 measured student. The mean total time per person in the photogrammetry method was 15.26 min, with a CI = (13.94 min, 16.58 min). Below is a summary (Table 10) with the results obtained:
Table 10. Activity and inactivity times in the photogrammetry method (min)
|
Average activity and inactivity times of the measurer and the ImageMeter mobile application in the photogrammetry method (min) |
|||
|
Measurers |
Function |
Activity times |
Inactivity times |
|
Measurer |
Take photographs and measurement |
AT (min) |
IT (min) |
|
15.26 |
0 |
||
|
AP (%) |
IP (%) |
||
|
100% |
0% |
||
|
ImageMeter (Stage 1) |
Project image to photograph |
AT (min) |
IT (min) |
|
2.06 |
0 |
||
|
AP (%) |
IP (%) |
||
|
100% |
0% |
||
|
ImageMeter (Stage 2) |
Measurement |
AT (min) |
IT (min) |
|
13.21 |
0 |
||
|
AP (%) |
IP (%) |
||
|
100% |
0% |
||
Source: Own elaboration
The average time in which stage 1 was carried out was 2.06 minutes. It should be noted that, in this stage, the measured students and the measurer participated. However, for stage 2, only the measuring student was counted, in an average time of 13.21 minutes. It could be observed that there was no idle time for both the measurer and the mobile application during both stages.
For comparison purposes, the average AE was calculated, where the observed value was the average total time per person practicing the proposed alternative methods (3D scanning or photogrammetry); and the expected value was the average total time per person of the traditional method. It was noted that the 3D scanning method had an average AE of +13.38 min and the photogrammetry method presented an average AE of -8.13 min compared to the traditional method.
The photogrammetry method reduced the average time per person by 32.16% compared to the time value of the traditional method. And the 3D scanning method, increased the time by 62.91% compared to the time value of the traditional method.
3. 1. Validation of the research methodology through piloting, paired test analysis and triangulation by experts
As explained in previous sections, pilot tests were carried out during each method presented. After knowing the anthropometric measurements obtained, paired T tests were carried out to compare the dimensions obtained by the measuring students in each alternative method with respect to the traditional method: for the 3D scanning method, it was noted that the measurements obtained tended to be lower than those of the instrument method. It was concluded that there was a significant difference; and for the photogrammetry method, it was concluded that the anthropometric measurements obtained in this method did not present a significant difference with respect to those obtained in the traditional method. A socialization was carried out with the professor of the subject, where he stated that the alternative photogrammetry method was more appropriate given the greater number of advantages it offered. Follow-up and review meetings were held by 3 experts in the area of Methods Engineering during the course of the research, where all 3 agreed that good practices were carried out to execute the initially proposed methodology, providing greater reliability for this study.
4. Discussions
The main contribution of this research was to analyze the advantages and disadvantages in terms of time, accuracy, cost and handling of the capturing technologies when using both alternative methods in a university anthropometric practice scenario.
In relation to the first objective set, the alternative photogrammetry method offered greater reliability in the results of the laboratory practice, taking the mean absolute error of estimation of the anthropometric measurements with respect to the measurements of the traditional method as a reference (mean AE = -0.40 cm). However, this method had the limitation that, in stage 2, three reference scales were needed (height, head width, and seat height) which were measured using height measurement instruments of the traditional method. Without these scales, the practice would not be possible. On the other hand, the alternative 3D scanning method (with mean AE = +4.19 cm) did not require those reference scales (already known dimensions) to take the anthropometric measurements; therefore, this became an additional advantage of this scanning method.
Next, related to the second objective, the photogrammetry method presented an improvement by reducing the time by 32.16% (average percentage relative error with an AE = -8.13 min) compared to the traditional method. This method presented the shortest average total duration time per person with a CI = (13.94 min, 16.58 min) at a 95% confidence level. The traditional method made evident the high percentage of underutilization by 2 of the 3 measurers. Measurer 1 was inactive 1.57% of the time; measurer 2 had an average idle time of 42.80% (9.14 minutes) of the total time; and measurer 3 presented idle time for 37.86% (8.08 minutes) of the total time. This method showed greater likelihood of wasted wait times and wasted talent. The alternative photogrammetry method presented the best percentage of activity by the measuring student at 100% compared to the other methods. The measuring student was idle for 78.82% (7.79 minutes) during the total time of the 3D scanning method. Both methods showed the improvement that only 1 measuring student was involved in the practice without having direct physical contact with the measured student, increasing the comfort level for both the measured subject and the measurer.
In relation to what was proposed in the third objective, studies of anthropometric measurements that do not consider prior piloting to identify improvements would have a higher degree of error, since they will not have contemplated potential improvements in relation to the accuracy of the final measurements to be made. In addition to the above, triangulation by experts contributed to making the study more reliable. The 3 methods engineering experts assessed this research during its development. In addition to the three experts, during the final evaluation of the project, a fourth expert conducted a final check. All of them agreed that the proposed methodology was developed with good practices.
This research project is defined at the proposal level; however, it could be implemented at a partial level in the Industrial and Systems Engineering Laboratory for anthropometry practices. The study is applicable to other institutions within the same educational field that have a similar theme in their curriculum.
5. Global Conclusion
It was found that the photogrammetry method offered greater reliability (AE = -0.40 cm) compared to the 3D scanning method (AE = +4.19 cm). The photogrammetry method had the highest percentage of activity by the measuring student, reaching 100%, and reduced the time by 32.16% (average percentage relative error with AE = -8.13 min) compared to the traditional method. On the other hand, the 3D scanning method resulted in a greater idle time for the measurer, accounting for 78.82% (7.79 minutes) of the total time. These results were found in this study according to the sample analyzed.
In general, the photogrammetry method presented a greater number of advantages in terms of reliability, time, cost and handling of the mobile application; with the disadvantage that reference scales were needed to take the measurements. The traditional method showed the existence of underutilized personnel; however, through alternative methods the number of measurers involved and the percentage of leisure were reduced and postural flexibility was promoted. The research had good practices through piloting, paired testing and triangulation by experts in relation to the analyzed sample of participating students and the socialization carried out with the Engineering Methods I professor.
The main contribution of this research was to analyze the advantages and disadvantages in terms of time, accuracy, cost and handling of the capturing technologies when using both alternative methods in a university anthropometric practice scenario.
A second stage of this study would consist of the use of the research line of Design of Experiments, where the following research questions would arise:
1) Question 1: What is the appropriate distance between the measured subject and the mobile phone camera to take photographs of the students to be measured in the photogrammetry method?
2) Question 2: What effect would it have on the final measurement of the photogrammetry method if a different reference scale other than the anthropometric measurements of the measured subject is taken (using a previously known measurement, for example, the height of an anthropometric bench)?
References
[1] Fourie, Z., Damstra, J., Gerrits, P. O., & Ren, Y. (2011). Evaluation of anthropometric accuracy and reliability using different three-dimensional scanning systems. Forensic Science International, 207(1), 127-134. https://doi.org/10.1016/j.forsciint.2010.09.018 View Article
[2] Koepke, N., Zwahlen, M., Wells, J. C., Bender, N., Henneberg, M., Rühli, F. J., & Staub, K. (2017). Comparison of 3D laser-based photonic scans and manual anthropometric measurements of body size and shape in a validation study of 123 young Swiss men. PeerJ, 5, e2980. View Article
[3] Gallegos, S. C. P., Mejía, G. I., Valles, G. R., Chávez, O. R., Saldaña, N. N., Hernández, A. L. P., & Valdiviezo, I. C. (2016). Desarrollo de un programa para antropometría por medio de fotogrametría. Cultura Científica y Tecnológica, 57, Article 57. View Article
[4] P. M. Pascua Cantarero, C. Y. Martínez Sorto, and S. J. Mejía Enamorado, "Proposal of initial parameters for an anthropometric database of the Honduran working population," in *Proc. 10th World Congr. Mechanical, Chemical, and Material Eng. (MCM'24)*, Barcelona, Spain, Aug. 22-24, 2024, Paper No. ICMIE 120. doi: 10.11159/icmie24.120. View Article
[5] Vega, G., Ávila, J., Vega, A., Becerril, A., & Amador, G. (2014). Paradigmas en la investigación. Enfoque cuantitativo y cualitativo (Vol. 10). View Article
[6] Sampieri, R., Collado, C., & Lucio, M. del P. (2010). Metodología de la Investigación (5ta edición) (5ta ed.). McGraw Hill.
[7] Sampieri, R., Collado, C., & Lucio, M. del P. (2014). Metodología de la investigación (6ta edición) (6ta ed.). McGraw Hill.
[8] Milián, L., Moncada, F., & Borjas, E. (2014). Manual de medidas antropométricas (p. 72). Instituto Regional de Estudios en Sustancias Tóxicas.
[9] Kanawaty, G. (1998). Introducción al estudio del trabajo (4ta ed.). Oficina Internacional del Trabajo.
[10] Walpole, R., Myers, R., Myers, S., & Keying, Y. (2012). Probability & Statistics for Engineers & Scientists (9th ed.). Pearson.
[11] Rumbo-Rodríguez, L., Sánchez-SanSegundo, M., Ferrer-Cascales, R., García-D'Urso, N., Hurtado-Sánchez, J. A., & Zaragoza-Martí, A. (2021). Comparison of Body Scanner and Manual Anthropometric Measurements of Body Shape: A Systematic Review. International Journal of Environmental Research and Public Health, 18(12), Article 12. https://doi.org/10.3390/ijerph18126213 View Article
[12] Prado, L., Ávila, R., & Herrera, E. (2005). Factores ergonómicos en el diseño-Antropometría.
[13] Niebel, B., & Freivalds, A. (2009). Niebel's Methods, Standards, & Work Design (12th ed.). McGraw Hill.
[14] Lescay, R. N., Alonso Becerra, A., & Hernández González, A. (2017). Anthropometry. Comparative análisis of technologies for the capture of anthropometric dimensions. Revista EIA, 13(26), 47-59. https://doi.org/10.24050/reia.v13i26.799 View Article
[15] Lehmann, G. (1975). Fotogrametría. Reverte.
[16] Boada, A. (2011). Limitaciones de los errores relativos en los pronósticos, una nueva propuesta para cuantificar los errores porcentuales en predicciones. CONHISREMI, 7, 1-18