Journal of Machine Intelligence and Data Science (JMIDS)

Volume 5 - Year 2024 - Pages 25-32
DOI: 10.11159/jmids.2024.004
Predictive Stadium Attendance Using Machine Leaning: A Case Study in Italian Football
Rosa Arboretti1, Nicolò Biasetton2, Riccardo Ceccato2, Alberto Molena2, Enrico Peruzzo3, Luigi Salmaso2, Alessio Sani3
1University of Padova, Department of Civil Environmental and Architectural Engineering,
Via Marzolo, 9, Padova, Italy, 35131
rosa.arboretti@unipd.it
2University of Padova, Department of Management and Engineering
Stradella San Nicola, 3, Vicenza, Italy, 36100
nicolo.biasetton@phd.unipd.it, riccardo.ceccato.1@unipd.it, alberto.molena.1@phd.unipd.it, luigi.salmaso@unipd.it
3ACF Fiorentina S.r.l., Via Pian di Ripoli n. 5, Bagno a Ripoli, Firenze, 50012
eperuzzo@acffiorentina.it, asani@acffiorentina.it
Abstract - Football is one of the most widely followed sports in Italy, and football clubs have now become fully-fledged businesses. In this context, it is of utmost importance to be able to predict match attendance. In this work, we propose a two-phase framework. In the first phase, through a survey containing a conjoint analysis, we will be able to identify fan preferences related to certain match attributes, such as weather, start time, and the day of the week on which the game is played. From the responses we gather, we will create a variable called “utility”, which is then included in the second phase, represented by the development of ML models with the aim of predicting stadium attendance. We have evaluated this approach in collaboration with an important Italian football Team playing in the first division, using historical data for the training and testing phase. Moreover, we have also applied the proposed methodology to a match of the current season (2023-24). Generally, we can say that the proposed framework performs quite well, allowing us to predict stadium attendance in advance.
Keywords: Football, Conjoint analysis, Machine Learning.
© Copyright 2024 Authors - This is an Open Access article published under the Creative Commons Attribution License terms. Unrestricted use, distribution, and reproduction in any medium are permitted, provided the original work is properly cited.
Date Received:2023-11-21
Date Revised: 2023-12-14
Date Accepted: 2024-01-23
Date Published: 2024-02-27
1. Introduction
Over the years, the economic impact of sporting events has become increasingly significant [1]. One of the most popular sports in Italy is football, with a national GDP impact estimated at around 11.1 billion [2].
As in all industries, planning is a fundamental activity in football: indeed, for instance, reliable stadium attendance estimates are crucial for clubs.
The reasons behind seeking an accurate prediction of this parameter are manifold: firstly, having a reasonably precise estimate of how many tickets will be sold means having a reliable estimate of the overall match revenue. Moreover, if a particular match is predicted to have low attendance, different promotional activities can be considered in order to boost it, if that is an objective.
Furthermore, there are also purely organizational reasons; clubs can plan various pre-match activities based on the estimated attendance, and they can also calculate the precise number of staff and security personnel needed for the game.
Some contributions concerning stadium attendance prediction can be found dating back to the 1970s [3, 4]. In recent years, with the advent of Machine Learning (ML), it has become possible to utilize these methodologies to achieve more accurate predictions.
Furthermore, as in all industries, having a strong knowledge of the customers is of utmost importance in predicting their behaviour. Therefore, to enhance our understanding of the customers and their preferences regarding attending matches at the stadium, we have developed a survey to be administered to fans. It includes a section of choice-based conjoint analysis, which enables us to gain a precise insight into the customer, allowing to indirectly extract their preferences regarding specific match attributes.
So, the paper’s objective is to predict stadium attendance for an Italian club competing in the top-tier football league. To achieve this, we have developed a framework consisting of two distinct phases. In the first phase, we conducted a survey among fans, which includes a conjoint analysis component, that will allow us to calculate a utility value that we will use in the predictive phase of our work.
Subsequently, we will construct various ML models using R, and starting from these, we will obtain the stadium attendance forecast.
The paper is structured as follows: in Section 2, we will provide a literature review related to football match attendance prediction. Then, in Section 3, we will delve deeper into the methodology. In Section 4, we will present the case study, while in Section 5 we will present a real case application of our proposed framework to a match of the 2023/24 season. Finally, section 6 will contain the conclusions and future work.
2. Related Work
As we have already seen in the previous section, there are several reasons why accurately predicting stadium attendance is of paramount importance in the actual football context.
The objective of our study is to create a ML model capable of predicting stadium attendance with great precision. In this specific example, achieving this goal will provide the opportunity for an Italian team, competing in the top national series, Serie A, and participating in European competitions, to plan certain activities in advance, as discussed in the previous section. Additionally, it helps in understanding how to increase profits, aided by the information derived from the conjoint analysis included in the survey conducted with fans.
In the literature, there are various examples of models designed to comprehend the impact of specific variables on stadium occupancy or simply to forecast stadium attendance based on certain factors. The innovative aspect of our work lies in the integration of conjoint analysis and ML models, enabling us to incorporate into these some insights gained directly from the fans in the survey.
In the literature, there are just a few examples of the application of conjoint analysis techniques in the football sector. For instance, the most relevant one for our study, is the work of Woratschek et al. [5], where conjoint analysis was employed to determine spectators’ willingness regarding price increases or reductions, considering competitions with different sporting significance and in different seating categories settings. In their work, the authors examined the impacts of three variables: match category (i.e., competition), ticket price, and seating category. From their analysis, it appears that the interviewees considered match category as the most important factor, followed by price, and finally, seating category. As just mentioned above this is one of the few studies that apply conjoint analysis in the domain of ticket in football events.
Regarding the prediction of match attendance, the literature provides various contributions. One such contribution is represented by the work of Fotache et al. [6], who used two R ecosystems, tidyverse and tidymodel, to develop a framework able to forecast the ticket sales of a club in the top Romanian league. They incorporated variables such as match weather conditions, kick-off time, day of the week on which the match occurred, phase of the season, opposing team, and the recent performances of the teams facing each other. They attempted to utilize both the Random Forest and Extreme Gradient Boosting (XGB) algorithms and achieved an R-squared of approximately 81%, with both algorithms.
Another noteworthy study is that of Sahin and Erol [7], who compared various ML models, including artificial neural networks (ANN), adaptive neurofuzzy inference system (ANFIS), and fuzzy rule based systems, to determine which of these methods would yield the most precise predictions in predicting match attendance. Their input variables included the match day, the distance in miles between the home and away team’s stadia, match uncertainty, and the recent performance of the teams involved in the match. They employed a dataset consisting of 236 matches of three top European clubs and used metrics such as Mean Absolute Percentage Error (MAPE) and Mean Absolute Deviation (MAD) for comparison. They found that, although all models performed well, the best was the ANN.
Another relevant study is that of Strnad et al. [8], in which the primary objective was to assess the impact of various variables, such as the home team, the away team, the rivalry between these teams, and the result uncertainty, on attendance. They evaluated the predictive quality of four different neural networks, using MAPE and mean absolute error (MAE) as metrics. Ultimately, it was revealed that neural networks are reliable in predicting stadium occupancy.
One more intriguing work is that of King and Rice [9], in which they compared the predictive performances of various machine learning models, specifically random forest, M5 prime, and extreme gradient boosting, with the accuracy obtained from traditional models like linear regression, using data from the 2014 and 2015 seasons of Major League Soccer, the top American national soccer league. In this case, the evaluation metric used was Mean Squared Error (MSE).
From their analysis, it emerged that extreme gradient boosting was the most accurate methodology.
In this section, we have thus demonstrated several examples of employing ML techniques for predicting attendance at football matches in stadiums.
3. Methodology
The methodology we intend to present consists of two distinct steps. Initially, the idea is to administer a survey to customers, which includes a conjoint analysis dedicated section, aiming to deepen our understanding of the customer. Conjoint analysis is a decompositional method introduced in the 1970s, that allows to assess trade-offs among various product characteristics [10, 11, 12]. To use this technique, it is necessary to define in advance the attributes that need to be evaluated and the levels of these attributes, which refer to the values these attributes can assume.
It is the task of the analyst to include the product characteristics they consider most relevant, also called attributes, and to include all possible levels of these characteristics. Once this is done, the so-called “cards” are created, which are particular combination of the attributes’ levels. Then, these profiles must be evaluated by the respondent and then statistically analysed to determine the customer preferred levels for the various characteristics.
The advantage of this technique is that being an indirect method for eliciting preferences, the results are not influenced by socially desirable responses. Moreover, it is important to emphasize that there are various types of conjoint analysis. In traditional conjoint analysis, respondents are asked to evaluate different profiles by assigning a rating to each profile or by ranking the various profiles. In 1983, Louviere and Woodworth [13] combined conjoint analysis and choice evaluation, creating choice-based conjoint analysis, where the respondent no longer needs to rate or rank each profile but is asked to choose between sets of profiles. This approach has two main advantages, as presented in the work of Raghavarao et Al. [14]: firstly, the choice is conceptually similar to making a purchase, and secondly, the respondent must consider the other alternatives in the choice set when making a selection, thus having a more comprehensive view of the alternatives at the time of choice.
Through traditional conjoint analysis techniques, such as the logit model, it is possible to estimate utility values for each level of each characteristic evaluated by the customer.
The second phase consists in modelling the data with ML algorithms in order to obtain a classification model capable of predicting, starting in particular from match and match day characteristics, if a stadium seat will be sold or not.
What is essential to emphasize, in our framework, is that the utility values of the levels of the various product characteristics obtained through conjoint analysis are condensed into a single indicator.
Our idea is to include this indicator among the predictive variables of the ML model we intend to develop, serving as the link between the two phases.
This choice is motivated by the idea that by implementing this variable into the ML model, we can include customer preferences in the ML model, considering not only historical data but also customer preferences, resulting in a model that can more accurately predict population behaviour.
4. Case study
As already mentioned, we have tested the approach we proposed in section 3 on a real case study developed in collaboration with an important football team competing in the Italian top division.
So, in the subsequent paragraphs we will present the settings of the case study and we will explain deeper how we implemented each phase of the proposed framework.
4. 1. Aim and data collection
In this case study, we collaborated with an Italian Serie A football team with the aim of creating predictive models for stadium attendance.ted by the data cleaning phase, which is followed by the clustering phase.
As previously mentioned, the work was structured following the methodology presented in Section 3. Firstly, we created a survey to be administered to the fans, which included a conjoint analysis section. Subsequently, we analysed the results and, based on these findings, we created a variable that was later incorporated into the ML models.
It’s important to highlight that we partnered with this team as they provided us with historical data concerning the team stadium attendance over the 2018-19, 2021-22, and 2022-23 seasons. Such choice has been derived by the fact that, due to COVID-19 pandemic, season 2020-2021 was not regularly disputed, especially in terms of fans’ attendance. The selected seasons represented the three last season for which the stadium ran at full capacity for all the season matches.
Furthermore, in the models, we also included variables, which will be presented in the following sections, obtained through web scraping, such as weather data related to the match or the performance of the home and away teams.
4.2 Conjoint analysis
In this initial phase, we created two surveys, very similar to each other, and, in particular, identical in the conjoint analysis section, to be administered to two distinct groups of fans.
The first group to whom we administered the survey consists of loyal fans, those who hold the team membership card, and have presumably attended the stadium at least once in their lifetime, and, most importantly, are devoted fans of the team. Regarding this group, for which we had email contact, we sent an email with an access code for the survey.
Regarding the second group, we decided to conduct the survey among those who follow the team on social media. In collaboration with the football club’s social media team, we created posts and stories dedicated to the survey. In this case, there was no need for a code to respond to the survey.
To streamline this section, we will not present the whole survey; instead, we will focus only on the conjoint analysis part, which is the aspect of primary interest in this work.
Regarding the attributes of the conjoint analysis, we have included six: stadium sector, opposing team category, game day, time slot, football season period, and weather.
We must clarify something that regards the stadium sectors: indeed, in this study, we aimed to predict fan attendance for home games played in a stadium, which is composed of 14 sectors. Clearly, we could not include an attribute with 14 levels in the conjoint analysis. Furthermore, it would not have made much sense as if we had included all the sectors in the same analysis; people would likely have chosen the best sector consistently, as we don’t consider the price in the attributes of our analysis. Therefore, we aggregated the sectors into six macro-sectors (comprising similar sectors) and, in a section prior to the conjoint analysis in the survey, we posed a question asking: “Considering the average price of the indicated macro-sector, please indicate in which macro-sector you have attended, or you could attend a league match.” This allowed us to create six different conjoint analysis, one for each macro-sector, with the same attributes mentioned earlier, but with different levels of the attribute stadium sector: indeed, for example macro-sector A included sector 1, sector 2 and sector 3, while macro-sector B included sector 4, sector 5 and sector 6, and so on.
In Table 1, we present the various levels that the six attributes listed earlier can assume, with the values of the stadium sectors reported here generally as sector 1, sector 2 and sector 3.
Table 1. List of attributes and levels for the conjoint analysis.
|
Attribute |
Level 1 |
Level 2 |
Level 3 |
|
Sector |
Sector 1 |
Sector 2 |
Sector 3 |
|
Opposing team category |
Top rank |
Medium rank |
Bottom rank |
|
Game day |
Weekday |
Weekend |
|
|
Time slot |
Afternoon (before 6 pm) |
Evening (from 6 to 8 pm) |
Night (after 8 pm) |
|
Football season period |
Start of the season |
Mid-season |
End of the season |
|
Weather |
Good weather |
Bad weather |
|
We adopted a choice-based conjoint analysis approach, so our respondents were asked to choose one out of three attributes’ combinations for eight different times: their choice represented the settings of the match they would prefer to attend.
The eight situations to be evaluated were randomly generated using the JMP software, which allow to perform both the design phase and the analysis of the results of the conjoint analysis.
In the survey of loyal fans, we obtained 3,577 responses, while in the open survey, we received 3,950 responses, totalling 7,527 responses.
Both surveys were available for eight days, in the middle of august 2023.
Before summarizing the results obtained from this analysis, it’s important to emphasize that the two respondent groups differ in age.
Indeed, in the survey for loyal fans, the majority of fans fall within the age range of 45 to 64 years, while in the social media-administered survey, the majority of fans are aged between 18 and 24 years. This was an expected outcome, especially given the extensive use of social media by younger individuals.
Concerning the conjoint analysis section, despite the age difference mentioned earlier, we found that the results of the conjoint analysis were identical between the two groups. Consequently, we decided to combine the responses from both questionnaires and conduct a unified analysis for each macro-sector.
In total, we conducted 6 macro-sector related conjoint analyses.
In table 2, the values of relative utility obtained from the analysis conducted through JMP are reported for a specific macro-sector: for example, from these values it emerges that, considering the fans that chose this specific macro-sector, they tend to prefer sector 10 instead of 11: indeed sector 11 has a positive utility, while sector 10 has a negative utility. Moreover, also the opposing team category result very important, as respondents express a strong preference in attending a match against a top rank team (highest utility value), while they are not so enthusiastic in attending a match when the visiting team belong to the bottom rank category. These values serve as the starting point for calculating the utility of each match combination. To compute this index, it is just necessary to sum the various utility values. For example, if we had the combination: sector 10, top rank, weekend, afternoon, mid-season, good weather, we would find that the utility of this combination equals 0.14637. In this way, as various match parameters change, we can determine the utility value for the combination of the attribute of that specific match for the analysed macro-sector.
Table 2. Relative utility values obtained for a macro-sector
|
Attributes |
Levels |
Relative utility |
||
|
Sector |
Sector 10 |
-0.64035 |
||
|
|
Sector 11 |
0.64035 |
||
|
Opposing team category |
Bottom rank |
-0.56060 |
||
|
Medium rank |
0.00347 |
|||
|
|
Top rank |
0.55714 |
||
|
Game day |
Weekday |
-0.19276 |
||
|
|
Weekend |
0.19276 |
||
|
Time slot |
Afternoon |
-0.16068 |
||
|
|
Evening |
0.08086 |
||
|
|
Night |
0.07981 |
||
|
Football season period |
End of the season |
0.00389 |
||
|
|
Mid season |
-0.04191 |
||
|
|
Start of the season |
0.03801 |
||
|
Weather |
Bad weather |
-0.23940 |
||
|
|
Good weather |
0.23940 |
||
A complication that arose in this phase was that the utilities found from the analysis were related to the macro-sector, as they came from macro-sector based conjoint analysis. This could make it seem like a combination had a very high utility even if, that macro-sector had been chosen by only a few people and represented only a portion of the respondents. To address this issue, we decided to weight the values obtained from the conjoint analyses of the macro-sectors by the percentage of fans who had chosen that specific macro-sector. This way, the most chosen macro-sector would be weighted more heavily than the others.
This value will be included in the various ML models we will develop.
4.3 ML models
As mentioned earlier, our objective was to create a ML model that predicts fan attendance at the stadium for a given match. In section 4.1, we discussed how we incorporated historical data provided by the team under study, along with other data such as weather conditions and recent team performances obtained through web scraping. Additionally, we used of the utility values obtained from the conjoint analysis, as outlined in section 4.2.
Regarding the ML models, we have chosen to create models where the unit of analysis is the individual seat within the stadium for each match of the seasons.
Consequently, the target variable is binary, indicating whether that specific seat will be sold for that match or not. This choice is motivated by the fact that we experimented two different approaches: predicting the percentage occupancy of the sector and predicting the sold or unsold status of each individual seat, with the latter approach demonstrating more convincing performance.
Before proceeding, two further clarifications must be made: firstly, we opted to develop a ML model for each sector to provide the collaborating team with the best possible performance for each sector. After testing various configurations, we realized the need for further stratification based on the opponent.
Therefore, we used the opponent categories presented in the conjoint analysis, namely top-rank, medium-rank, and low-rank. These categories are defined as follows: the top 7 teams from the previous season are considered top-rank, teams ranked between 8th and 13th in the previous season are considered medium-rank, and those placing below 14th, including newly promoted teams, are classified as bottom-rank.
Table 3 summarizes all the variables used in the machine learning models.
Table 3. List of the variable used in the ML models.
|
Variable name |
Variable description |
|
Sector |
Sector |
|
Row |
Row |
|
Seat |
Seat |
|
Matchday mean temperature |
Mean temperature on matchday |
|
Matchday weather conditions |
Weather conditions on matchday |
|
Day of the week |
Day of the week of the match |
|
Time slot |
Time slot of the match |
|
Home team rank |
Home team rank on matchday |
|
Away team rank |
Away team rank on matchday |
|
Home team match undefeated |
Home team match since last defeat |
|
Away team match undefeated |
Away team match since last defeat |
|
Utility |
Utility of the match, as obtained in the conjoint analysis |
|
Price |
Ticket price for the match (depends on the sector) |
|
Sold (Target variable) |
Variable indicating if the seat considered was sold or not sold in the match considered |
Regarding the ML models, we chose to use the R library H2O, specifically the AutoML function [15].
This approach aims to find the most suitable model by testing and evaluating various ML models, including Random Forest, Generalized Linear Models with regularization, Extreme Gradient Boosting Machine, and Neural Networks; moreover, it also allows for creating ensembles of the aforementioned models.
The application of this library provides an output in the form of a leaderboard of the tested models, ranked according to a chosen metric. In our case, as we are dealing with a binary classification problem, we selected accuracy as our metric; this is a widely used metric, and it is presented here in Eq. 1:

where TP represents the number of true positive (so positive observations that are correctly classified), TN represents the number of true negative (negative observations that are correctly classified), FP represents the number of false positive (negative observations which are wrongly classified as positive) and lastly FN represents the number of false negative (positive observations which are wrongly classified as negative).
It is important to emphasize that for each sector of the stadium, we created three distinct models: one for matches against top-rank opponents, one for matches against mid-rank opponents, and one for matches against low-rank opponents.
Since there are 14 stadium sectors, we ended up obtained 42 different models.
To construct these models, we followed the typical training-testing approach of ML models. The initial phase, the training phase, was executed using 75% of the available data and a 5-fold cross validation (CV), while the remaining 25% of cases were reserved for the testing phase.
From the result obtained, we can say that there are no models that perform imprecisely. Generally, the classification error consistently remains below 7%. Of course, the value of the error increases slightly if we consider the false positive rate, meaning those cases in which the ticket was not sold but the model predicts it was sold, due to an inherent data imbalance. In general, however, we can consider the model’s performance to be quite acceptable.
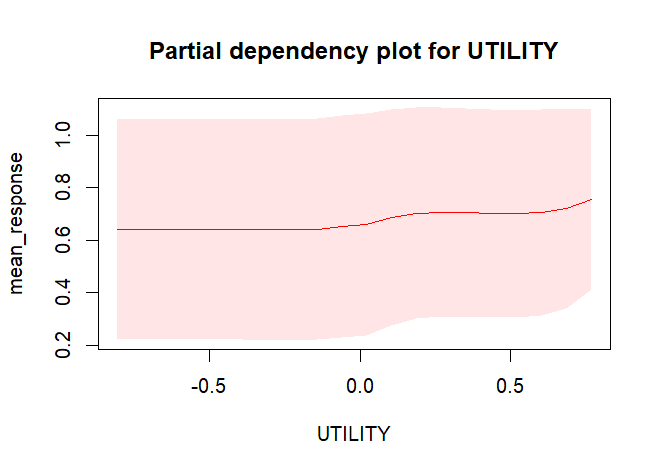
Figure 1 represents the partial dependence plot of the utility variable, constructed from the results of the conjoint analysis, on the average probability that a seat will be sold, considering a specific ML model created for a certain category of opponents in a particular sector of the stadium.
For the sake of clarity, the partial dependence plot is a graph that provides a graphical depiction of the marginal effect of a variable on the response. As it may be observed in the graph, when the utility increases, the probability of selling the seat also increases. Moreover, in the figure are reported also the confidence interval, which are represented by the red bands, over and under the line. This behaviour implies that the utility variable provides valuable insight; in fact, if its value increases, indicating more favourable conditions, it means that the seat is more likely to be sold.
5. Real case application: attendance prediction
In this section, we will briefly present the application of the framework described to a match of the 2023-24 season, specifically the first home game of the team we are collaborating with. We will provide a comparison between the predictions obtained using the hypothesized framework and the actual stadium attendance data.
In this case, the opposing team belonged to the low rank category, thus we used the models related to low rank opponents.
So, as a first step, we created a dataset containing all the seats in the stadium, and for each variable described in Table 3, we assigned the values specific to that match, such as weather, time, and day of the game. Afterward, for each sector, we calculated the utility value, starting from the relative utilities for each level of each attribute obtained from the conjoint analysis.
Then, we ran the ML models and obtained the occupancy predictions. Lastly, we computed the error we obtained for each section of the stadium, calculated as the difference between predicted sales and actual sales, in percentage.
From our analysis, it emerges that generally the error is lower than 7% (this happens in 10 out of 14 sectors), while there are some cases that have a higher error rate: specifically, three of them have an error ranging from 10% to 16%, while one sector has a higher error, approximately 31%. Furthermore, from the results it can be observed that the predicted attendance is consistently higher than the actual attendance (in 13 out of 14 sectors).
Therefore, based on the results obtained from the comparison between the proposed framework and current sales, we can generally conclude that the developed models provide good performance, although there are some critical cases.
6. Conclusion
In this work, we have presented a novel approach for predicting football match attendance, which integrates a component of conjoint analysis and ML models.
The methodology we proposed consists of two main parts: one in which we collect fan preferences regarding the conditions they prefer for attending a match through a survey, using conjoint analysis, and then we create a utility index that represents how much fans favour the conditions of a particular match. This index is then incorporated into the various predictors of the ML models to integrate fan preferences into the model, aiming to enhance both the model’s interpretability and performance.
We have demonstrated how this approach performs well in the training and testing phases and still performs reasonably well when tested on new data. The developed models can be adopted, once identified the match characteristics and predicted those to be predicted (as weather conditions), by the Club for which they are developed to predict attendance to each season match. Another possible related work is to develop an optimization procedure that using the developed models, sector by sector, varies the ticket prices to maximize profit and attendance.
We can conclude that this method requires further investigation, and indeed, we intend to apply this methodology to predict stadium attendance throughout the football season to assess its long-term performance.
References
[1] A. M. Martins and S. Cró, "The demand for football in Portugal: New insights on outcome uncertainty," Journal of Sports Economics, vol. 19, no. 4, pp. 473-497, 2018. View Article
[2] M. Carrà, "Il calcio italiano in rosso: nel 2021-2022 ha perso 1,4 miliardi di euro," Forbes Italia. Accessed: Oct. 24, 2023. [Online]. Available: View Article
[3] R. G. Noll and R. G. Noll, Attendance and price setting." Pp. 115-158. The Brookings Institute Washington, 1974.
[4] H. G. Demmert, The economics of professional team sports. Lexington, Mass: Lexington Books, 1973.
[5] H. Woratschek, M. Kaiser, C. Durchholz, and T. Ströbel, "Preisaufschläge für die sportliche Relevanz," German Journal of Exercise and Sport Research, vol. 50, no. 3, pp. 406-416, 2020. View Article
[6] M. Fotache, I.-C. Cojocariu, and A. Bertea, "High-level machine learning framework for sports events ticket sales prediction," in Proceedings of the 22nd International Conference on Computer Systems and Technologies, 2021, pp. 55-60. View Article
[7] M. Şahin and R. Erol, "Prediction of attendance demand in European football games: Comparison of ANFIS, fuzzy logic, and ANN," Computational Intelligence and Neuroscience, vol. 2018, 2018. View Article
[8] D. Strnad, A. Nerat, and Š. Kohek, "Neural network models for group behavior prediction: a case of soccer match attendance," Neural Computing and Applications, vol. 28, pp. 287-300, 2017. View Article
[9] B. E. King and J. Rice, "Predicting attendance at major league soccer matches: a comparison of four techniques," J. Comput. Sci. Inf. Technol, vol. 6, pp. 15-22, 2018. View Article
[10] P. E. Green and V. Srinivasan, "Conjoint analysis in marketing: new developments with implications for research and practice," Journal of marketing, vol. 54, no. 4, pp. 3-19, 1990.
[11] P. E. Green and V. R. Rao, "Conjoint measurement-for quantifying judgmental data," Journal of Marketing research, vol. 8, no. 3, pp. 355-363, 1971. View Article
[12] R. M. Johnson, "Trade-off analysis of consumer values," Journal of marketing research, vol. 11, no. 2, pp. 121-127, 1974. View Article
[13] J. J. Louviere and G. Woodworth, "Design and analysis of simulated consumer choice or allocation experiments: an approach based on aggregate data," Journal of marketing research, vol. 20, no. 4, pp. 350-367, 1983. View Article
[14] D. Raghavarao, J. B. Wiley, and P. Chitturi, Choice-based conjoint analysis: models and designs. CRC Press, 2010. View Article
[15] E. LeDell and S. Poirier, "H2o automl: Scalable automatic machine learning," in Proceedings of the AutoML Workshop at ICML, ICML, 2020.