Journal of Machine Intelligence and Data Science (JMIDS)

Volume 5 - Year 2024 - Pages 01-07
DOI: 10.11159/jmids.2024.001
A Data-Driven Approach to Understanding Customer Satisfaction
Elena Barzizza1, Stuart Campbell2, Riccardo Ceccato1, Anna Dobosz2, Marco Haag2, Rafaella Martins2, Luigi Salmaso1
1University of Padova, Department of Management Engineering, 3 Stradella San Nicola, 36100, Vicenza, Italy
2Reckitt R&D Automatic Dishwashing, Robert-Koch-Str. 1, 69115 Heidelberg, Germany
elena.barzizza@phd.unipd.it; stuart.campbell@reckitt.com; riccardo.ceccato.1@unipd.it; anna.dobosz@reckitt.com; marco.haang@reckitt.com; rafaella.martins@reckitt.com; luigi.salmaso@unipd.it.
Abstract - The study of customer satisfaction has become a pivotal aspect of business for companies nowadays, particularly in the realm of new product development. As businesses strive to innovate and introduce new products to market, understanding and anticipating customer satisfaction has gained heightened significance. To achieve this, companies must be able to harness customer data and employ effective data analytics. With this in mind, this study proposes a machine learning-based approach to identify drivers of satisfaction and predict the effect of successful improvement of specific features of a product on customer satisfaction. A case study is conducted to better illustrate the proposed procedure.
Keywords: Machine Learning, Customer Satisfaction.
© Copyright 2024 Authors - This is an Open Access article published under the Creative Commons Attribution License terms. Unrestricted use, distribution, and reproduction in any medium are permitted, provided the original work is properly cited.
Date Received:2023-11-14
Date Revised: 2023-11-24
Date Accepted: 2023-12-03
Date Published: 2024-01-19
1. Introduction
Customer satisfaction can be defined as the ratio between customer expectations and perceptions (Kracklauer et al.); likewise, it quantifies the capability of a product or service to meet consumer expectations (Ngai et al.).
Today, the study of customer satisfaction has become a key area of business for companies. Indeed, there is a clear link between customer satisfaction and company performances (Yeung & Ennew). Given the competitiveness of today’s markets, the study of customer satisfaction represents a key element which may help companies create and keep a competitive advantage (Patterson).
In particular, companies want to know which drivers have the greatest impact on customer satisfaction for the purposes of guiding business choices (Tama). In this framework, analysis of big data can enhance both customer experience and company efficiency given that big data has the potential to discover value and support businesses’ decision-making processes (D. Polding & Eizaguirre Dieguez). As such there is a need for dedicated tools in advanced analytics, such as machine learning algorithms, which can determine the impact of drivers on overall satisfaction as well as predict overall satisfaction.
Most customer satisfaction studies in the literature collect consumer data by administering questionnaires to a sample of consumers or by extracting consumer reviews from the Internet. For example, Li et al., like Zhao et al., focused on the study of customer satisfaction with hotel experiences by extracting and analysing data from online reviews, while in Goode et al. a questionnaire was administered to study overall satisfaction with mobile phone use. The data are analysed using several different tools, including descriptive statistics, comparative statistics, such as Z-tests or one-way ANOVA (Bhat & Darzi), qualitative analysis, such as the House of Quality matrix (Haslinah et al.), ad hoc platforms for data analysis, such as “Tmall” described in (Ming), regression analysis and multivariate linear regression (Li et al.; Zhao et al.), as well as the most common machine learning techniques both for regression or classification tasks, such as linear regression, decision trees, support vector machines, ensemble learning, Gaussian process regression, and artificial neural networks (Cavalcante Siebert et al.; Goode et al.; Zeinalizadeh et al.; Tama).
Two types of data are usually considered in such analyses to cover both tangible and intangible aspects of a product or service. For instance, to study customer satisfaction with fast food restaurants, Tama took into account food quality and presentation as well as atmosphere within the restaurant and staff behaviour, among other things. Typically, these are measured as numerical variables, using Likert scales, or as categorical variables, particularly in the case of demographic characteristics of consumers.
The benefits of such analyses are multiple: strengthening customer satisfaction can improve a company’s marketing capabilities (Bhat & Darzi; Ming) because it allows the company to focus on customer preferences; it allows the formulation of demand management strategies targeted at specific groups of customers (Bhat & Darzi); consumer data analysis can also offer important guidelines to research and development departments (Haslinah et al.) to develop new products aligned with consumer expectations. Indeed, customer satisfaction is fundamental for both marketers and consumer researchers both from a theoretical and practical point of view (Westbrook & Oliver; Dabholkar et al.; Goode & Moutinho; Patterson; Spreng et al.; Fournier & Mick; Meuter et al.).
Strategic decisions are also positively influenced by consumer data analysis; for instance, it can empower brand management (Hwang & Kandampully). Improvements are also seen in competitive advantages (Tama) and performances (Cavalcante Siebert et al.) of companies. Finally, the results can help companies better understand which key aspects have an impact on customer satisfaction (Goode et al.; Li et al.) so that a more comprehensive study of customer satisfaction is possible (Oh et al.).
In this article, our aim is to set out a new framework of customer satisfaction analysis which differs considerably from the one presented in the literature. The methodology is machine learning-based and allows the analysis of consumer data from, for example, a questionnaire completed by a sample of consumers. The key aspect of this methodology makes it particularly useful for both research and development and marketing purposes. Firstly, our method makes it possible to rank the drivers with the greatest impact on a desired key performance indicator (i.e. overall rating, overall liking, overall satisfaction) and provides a clear measure of their impact. Secondly, the methodology compares different versions of the same product depending on the most significant drivers with respect to a chosen key performance indicator. In particular, it provides a measure of the difference between the two products (gap analysis) for each important driver, a measure of the improvement of the key performance indicator if the ratings for a certain driver were at their maximum, and a measure of the size of the effect of that driver.
The article is structured as follows: in Section 2 the proposed methodology is illustrated in detail; Section 3 presents a case study to show its applicability and utility; final remarks are discussed in Section 4.
2. Methodology
Data transformation
Consumer data are often collected through questionnaires containing series of evaluations of different aspects of a product or experience related to a service. These evaluations are commonly made using a 5-point Likert scale (as for example in Zeinalizadeh et al.; Haslinah et al.; Bhat & Darzi) where 1 means “strongly agree” and 5 means “strongly disagree”. However, conducting an analysis using the mean value of these ratings can result in misleading interpretations (Jones & Sasser). Use of a top box measure can offer a suitable solution to obtain stronger results from the analysis of the relationship between satisfaction and performance (Morgan & Rego). Indeed, top box consumers are more loyal and valuable, will spend more on company products and present the highest probability of buying more than once (Jones & Sasser).
For this reason all Likert scale predictors and the outcome are firstly transformed into binary variables so that they all have a common scale: TB (Top Box score) - Other (other scores). The remaining predictors are all encoded as Yes-No variables.
Given that the outcome variable Y is now binary, we are faced with a binary classification problem.
Variable impact
Following the data transformation step, we look for the model that best predicts Y. Indeed, it is of fundamental importance to consider and compare multiple machine learning models to identify the one that best fits the existing relationships in the available data.
To this end, the user must be able to accurately evaluate the model’s performances. Firstly, an appropriate error metric is required. For the classification problem at hand, AUC is the ideal solution given that it allows us to assess a model's overall discriminatory power (Bradley). Secondly, resampling techniques, such as cross-validation or bootstrapping, should be used so that model performances can be better evaluated and the risk of overfitting can be reduced.
We therefore propose using 10-fold cross-validation for hyperparameter tuning and model selection, retrieving the cross-validated AUC for each model and selecting the one with the highest AUC. The selected model can then be adopted to investigate the existing relationships between the input variables and the response.
To estimate the impact of a driver Xj, we suggest using this model to predict the TB probability for all the observations in two different datasets:
- D1j - a fictional dataset corresponding to the original training set with the actual levels of Xj replaced by TB (or Yes, if the predictor did not originally have a Likert scale).
- D2j - a fictional dataset corresponding to the original training set with the actual levels of Xj replaced by Other (or No, if the predictor did not originally have a Likert scale).
With ![]() as the predicted TB probability for observation i in dataset Dkj, we then retrieve the average probability
as the predicted TB probability for observation i in dataset Dkj, we then retrieve the average probability ![]() . The impact of Xj on Y can be quantified by the difference
. The impact of Xj on Y can be quantified by the difference ![]() .
.
Space for improvement
Companies are often interested in understanding what would happen to overall customer satisfaction if they improved a specific aspect of their product (e.g. the packaging).
To do that we introduce the concept of space for improvement, which quantifies how much improvement in Y could be achieved by improving the input Xj.
The first step is the same as before; we search for the best performing model.
We then use it to predict the TB probability for all observations in two different datasets:
- T - the original training set.
- D1j - a fictional dataset corresponding to the original training set with the actual levels of Xj replaced by TB (or Yes, if the predictor did not originally have a Likert scale).
With ![]() as the predicted TB probability for observation i in dataset T and
as the predicted TB probability for observation i in dataset T and ![]() the predicted TB probability for observation i in dataset D1j, we then retrieve the average probabilities
the predicted TB probability for observation i in dataset D1j, we then retrieve the average probabilities ![]() and
and ![]() . The space for improvement in Y to Xj can be quantified by the difference
. The space for improvement in Y to Xj can be quantified by the difference ![]() .
.
3. Case study
In this section we consider a case study and apply the methodology described in the previous section. A research and development team developed 10 different prototypes of earphones. The team’s aim is to understand which drivers most greatly influence customer satisfaction so that subsequent development work focusses on those important aspects. They also want to compare the prototypes to an existing product on the market so as to highlight their strengths and weaknesses.
To this end a group of 2040 consumers took part in a trial. Each was assigned a product, one of which was already available on the market. At the end of the trial period the participants were asked to complete a short questionnaire to evaluate their experience. The questionnaire looked at technical information, such as type of earphones (wireless or not) and the presence of noise cancelling options, as well as the evaluation of different aspects of the product. With regard to the latter, participants were asked to evaluate: overall rating after the trial period, which is a key performance indicator as it is a measure of customer satisfaction; sound quality; soundproofing; design of the earphones; packaging; comfort of use; adequacy of battery life; adequacy of recharging times; ease of use; opinion on the product’s weight and dimensions; quality of phone calls made using the earphones; quality of the integrated microphone; and overall liking of the maximum volume level. All these aspects were evaluated using a 10-point Likert scale where 1 corresponded to “Excellent” and 10 to “Poor”. The questionnaire contained the variables shown in Table 1.
Table 1. Variables collected using the questionnaire
|
Variable |
Measure |
|
Overall_rating = Overall customer satisfaction after trying the product for a defined period of time |
10-point Likert scale (1 = excellent – 10 = poor) |
|
Sound_quality = Quality of sound produced by the earphones |
10-point Likert scale (1 = excellent – 10 = poor) |
|
Soundproofing = Noice isolation/blocking capability |
10-point Likert scale (1 = excellent – 10 = poor) |
|
Overall_design = Appreciation of the earphones’ design |
10-point Likert scale (1 = excellent – 10 = poor) |
|
Overall_packaging = Appreciation of the earphones’ packaging |
10-point Likert scale (1 = excellent – 10 = poor) |
|
Comfort = Comfort experienced while using the earphones |
10-point Likert scale (1 = excellent – 10 = poor) |
|
Battery_life = Adequacy of battery life |
10-point Likert scale (1 = excellent – 10 = poor) |
|
Recharge_time = Adequacy of charging times |
10-point Likert scale (1 = excellent – 10 = poor) |
|
Easy_use = Ease of use of the earphones (ease of installation, ease of connection, ease of recharge, ease of storage) |
10-point Likert scale (1 = excellent – 10 = poor) |
|
Weight_dimension = Adequacy of the earphones’ weight and dimension |
10-point Likert scale (1 = excellent – 10 = poor) |
|
Quality_call = Quality of phone calls while using the earphones |
10-point Likert scale (1 = excellent – 10 = poor) |
|
Quality_microphone = Quality of the integrated microphone |
10-point Likert scale (1 = excellent – 10 = poor) |
|
Maximum_sound_level = Adequacy of the maximum sound level produced by the earphones |
10-point Likert scale (1 = excellent – 10 = poor) |
|
Wireless = Wireless capability |
1 = yes – 0 = no |
|
Noise_cancelling = Availability of noise cancelling option |
1 = yes – 0 = no |
Of note, the variables measured on the 10-point Likert scale were treated as binary variables. To do so, all responses equal to 1 (i.e., “Excellent”) were classified as “TB”, and all other responses were classified as “Other”. In this way the problem became one of classification, and we applied several different machine learning algorithms for classification purposes. We then considered only the machine learning algorithm with the highest AUC.
To address the first part of the problem, i.e. a variable’s impact on customer satisfaction, we applied the first part of the methodology described in the previous section. The following performance measures were obtained from application of the machine learning algorithms (see Table 2). For confidentiality purposes related to our case study, we will designate the machine learning models with generic names, such as ML1, ML2 and so on.
Table 2. AUC of the machine learning models
|
ML algorithm |
AUC |
|
ML1 |
0.94 |
|
ML2 |
0.95 |
|
ML3 |
0.94 |
|
ML4 |
0.94 |
The results of the first part of the analysis are shown in Figure 1. These were achieved by applying the machine learning model to the overall sample, using the best performing algorithm, i.e. ML2.
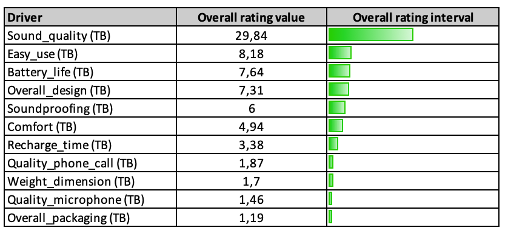
Percentages and bars are used to visualise the impact of each driver on the overall rating and are reported in descending order. The length of each bar is proportionate to the size of the effect. For instance, quality of sound accounts for approximately 30% of the overall rating and consequently the predicted difference in overall rating TB probability between consumers answering Sound_quality = TB and those answering Sound_quality = Other is about 30%.
These results can help the research and development team to understand which elements of the product’s design have a significant impact on customer satisfaction expressed as Overall_rating. Secondly, it gives a measure of impact on specific key performance indicators. As a result, the R&D team now has information on what to focus on to improve the product and maximise satisfaction. Better sound quality, improved ease of use, longer battery life, a well-studied design, better ergonomics and reduced charging times will enhance overall satisfaction and lead to a more appreciated product being offered on the market. As can clearly be seen, the earphones’ technical aspects, such as the wireless option or the possibility of activating noise cancelling, do not seem to impact on overall customer satisfaction.
To address the second part of the problem regarding a comparison between the developed prototypes and a market competitor, we performed a space for improvement analysis as described in the methodology section. Once again, we tried several different machine learning models and selected the one which performed best in terms of the AUC measure.
As before, for confidentiality purposes related to our case study, we will designate the machine learning models with generic names, such as ML5, ML6 and so on.
The performance results are shown in Table 3.
Table 3. AUC of the machine learning models
|
ML algorithm |
AUC |
|
ML5 |
0.94 |
|
ML6 |
0.96 |
|
ML7 |
0.95 |
|
ML8 |
0.95 |
We conducted the machine learning analysis using the best performer, which was ML6. To understand the results of the gap analysis, how to interpret the results, and the main utilities of this part of the methodology, we focus on the comparison between prototype 6 and a market competitor.
A visual representation of the results of this part of the analysis is provided by the graph in Figure 2.
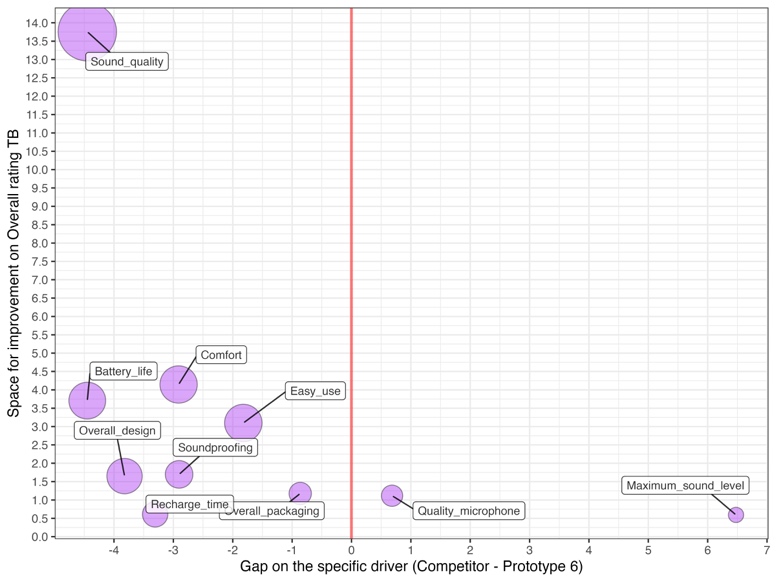
Several useful pieces of information can be extracted. First of all, the x-axis highlighted the gaps in relation to specific drivers, which means the difference in terms of TB percentage for a specific driver between the prototype and the competitor. For instance, Maximum_sound_level shows a gap of 6.5% which means the competitor outperforms the prototype under analysis in terms of this aspect. On the contrary, Battery_life shows a gap of -4.5% which means that prototype 6 outperforms the market competitor in terms of this particular characteristic of the device. In general, it seems that the competitor has an advantage in terms of quality of the integrated microphone and maximum level of reproducible sound. On the other hand, features of the prototype appreciated more than those of the competitor include sound quality, comfort of use, long battery life, ease of use, design, soundproofing, lower charging times, and packaging. We can therefore state that this prototype is very promising given that it outperforms the competitor in relation to several aspects. This part of the analysis can be very useful to clearly identify the strengths and weaknesses of a developed prototype compared to another product, i.e. a market competitor.
Secondly, the y-axis measures the space for improvement in customer satisfaction expressed in terms of Overall_rating, which represents the difference between TB probability in the Overall_rating due to having a TB rating for a specific driver, and TB probability in the Overall_rating calculated for the observed values of the driver; in other words the net effect with respect to the impact of all the remaining drivers. For instance, sound quality has space for improvement of about 14% which means that if all respondents answered Sound_quality = TB, we would have an improvement in Overall_rating TB probability of 14%. Overall_packaging has space for improvement of about 1%. Analysis of these values allows the R&D team to understand which aspects merit the focus of the next stages of research and development in order to maximise customer satisfaction. In our example the right choice to make in planning the next stages of activity would be to focus on improving sound quality rather than reducing charging times.
Finally, the radius of the bubble is proportionate to the size of the effect of the specific driver on overall rating. For instance, sound quality has a larger bubble and therefore greater effect than packaging. This information is to a certain extent linked to the previous result.
4. Conclusion
In this study we proposed a machine learning-based methodology to enhance customer satisfaction research. In particular, it provides useful points for reflection. Firstly, it clearly identifies the variables that have an impact on customer satisfaction and quantifies that impact. Secondly, it allows us to compare different products and identify their strengths and weaknesses. Lastly, this methodology shows what would happen to overall customer satisfaction if a specific aspect of a product was improved, giving important insights into the aspects on which it is worth focussing future improvements.
References
[1] Bhat, Suhail Ahmad, & Mushtaq Ahmad Darzi. «Exploring the influence of consumer demographics on online purchase benefits». FIIB Business Review, vol. 8, fasc. 4, 2019, pp. 303-16. View Article
[2] Bradley, Andrew P. «The use of the area under the ROC curve in the evaluation of machine learning algorithms». Pattern recognition, vol. 30, fasc. 7, 1997, pp. 1145-59. View Article
[3] Cavalcante Siebert, Luciano, et al. «Predicting customer satisfaction for distribution companies using machine learning». International Journal of Energy Sector Management, vol. 15, fasc. 4, 2021, pp. 743-64. View Article
[4] D. Polding, Robert, & Maria Eizaguirre Dieguez. «An Investigation into the Effectiveness of Big Data in Organizations, the Use of Customer Data, and the Ethical Implications of the Data Economy». 2021 International Symposium on Electrical, Electronics and Information Engineering, 2021, pp. 599-607. View Article
[5] Dabholkar, Pratibha A., et al. «A measure of service quality for retail stores: scale development and validation». Journal of the Academy of marketing Science, vol. 24, 1996, pp. 3-16. View Article
[6] Fournier, Susan, & David Glen Mick. «Rediscovering satisfaction». Journal of marketing, vol. 63, fasc. 4, 1999, pp. 5-23. View Article
[7] Goode, Mark MH, et al. «Determining customer satisfaction from mobile phones: A neural network approach». Journal of Marketing Management, vol. 21, fasc. 7-8, 2005, pp. 755-78. View Article
[8] Goode, Mark, & Luiz Moutinho. «The effects of consumers age on overall satisfaction: An application to financial services». Journal of Professional Services Marketing, vol. 13, fasc. 2, 1996, pp. 93-112. View Article
[9] Haslinah, Andi, et al. «Product development analysis of dragon fruit praline chocolate by using Quality Function Deployment (QFD) method». AIP Conference Proceedings, vol. 2595, fasc. 1, AIP Publishing, 2023. View Article
[10] Hwang, Jiyoung, & Jay Kandampully. «The role of emotional aspects in younger consumer‐brand relationships». Journal of Product & Brand Management, vol. 21, fasc. 2, 2012, pp. 98-108. View Article
[11] Jones, Thomas O., & W. Earl Sasser. «Why satisfied customers defect». Harvard business review, vol. 73, fasc. 6, 1995, pp. 88-.
[12] Kracklauer, Alexander H., et al. «Customer management as the origin of collaborative customer relationship management». Collaborative customer relationship management: taking CRM to the next level, Springer, 2004, pp. 3-6. View Article
[13] Li, Hongxiu, et al. «Comprehending customer satisfaction with hotels: Data analysis of consumer-generated reviews». International Journal of Contemporary Hospitality Management, vol. 32, fasc. 5, 2020, pp. 1713-35. View Article
[14] Meuter, Matthew L., et al. «Self-service technologies: understanding customer satisfaction with technology-based service encounters». Journal of marketing, vol. 64, fasc. 3, 2000, pp. 50-64. View Article
[15] Ming, Gu. «Application research of customer big data analysis for online shop based on smart cloud platform tools». 2022 IEEE 2nd International Conference on Power, Electronics and Computer Applications (ICPECA), IEEE, 2022, pp. 1142-45. View Article
[16] Morgan, Neil A., & Lopo Leotte Rego. «The value of different customer satisfaction and loyalty metrics in predicting business performance». Marketing science, vol. 25, fasc. 5, 2006, pp. 426-39. View Article
[17] Ngai, Eric WT, et al. «Application of data mining techniques in customer relationship management: A literature review and classification». Expert systems with applications, vol. 36, fasc. 2, 2009, pp. 2592-602. View Article
[18] Oh, Soyoung, et al. «Deep learning model based on expectation-confirmation theory to predict customer satisfaction in hospitality service». Information Technology & Tourism, vol. 24, fasc. 1, 2022, pp. 109-26. View Article
[19] Patterson, Paul G. «Expectations and product performance as determinants of satisfaction for a high‐involvement purchase». Psychology & Marketing, vol. 10, fasc. 5, 1993, pp. 449-65. View Article
[20] Spreng, Richard A., et al. «A reexamination of the determinants of consumer satisfaction». Journal of marketing, vol. 60, fasc. 3, 1996, pp. 15-32. View Article
[21] Tama, Bayu Adhi. «DATA MINING FOR PREDICTING CUSTOMER SATISFACTION IN FAST-FOOD RESTAURANT.» Journal of Theoretical & Applied Information Technology, vol. 75, fasc. 1, 2015.
[22] Westbrook, Robert A., & Richard L. Oliver. «Developing better measures of consumer satisfaction: some preliminary results». ACR North American Advances, 1981.
[23] Yeung, Matthew CH, & Christine T. Ennew. «From customer satisfaction to profitability». Journal of strategic marketing, vol. 8, fasc. 4, 2000, pp. 313-26. View Article
[24] Zeinalizadeh, Nooshin, et al. «Modeling and analysis of bank customer satisfaction using neural networks approach». International Journal of Bank Marketing, vol. 33, fasc. 6, 2015, pp. 717-32. View Article
[25] Zhao, Yabing, et al. «Predicting overall customer satisfaction: Big data evidence from hotel online textual reviews». International Journal of Hospitality Management, vol. 76, 2019, pp. 111-21. View Article